- Study Abroad
- / gre
- / statistics
GRE Statistics: Concepts, Formulas & Practice Questions


Author
19-02-2025

GRE statistics, a part of the Quantitative Reasoning section of the GRE General Test, encompasses the study of data, including its collection, analysis, interpretation, presentation, and organisation. It involves understanding and applying concepts such as mean, median, mode, range, quartiles, percentiles, standard deviation, variance, etc. Candidates can expect two to three questions on GRE statistics, covering topics such as averages and other statistical concepts. These questions vary in difficulty, ranging from easy to hard. To improve your score in the GRE Quant section, it is essential to have a solid understanding of key statistical concepts, particularly those related to central tendency, dispersion, and data distribution. In this article, you will learn all the GRE statistics concepts, their formulas, examples, and practice questions to enhance your GRE preparation.
Here is an infographic summarising essential statistics concepts in the GRE Math section.
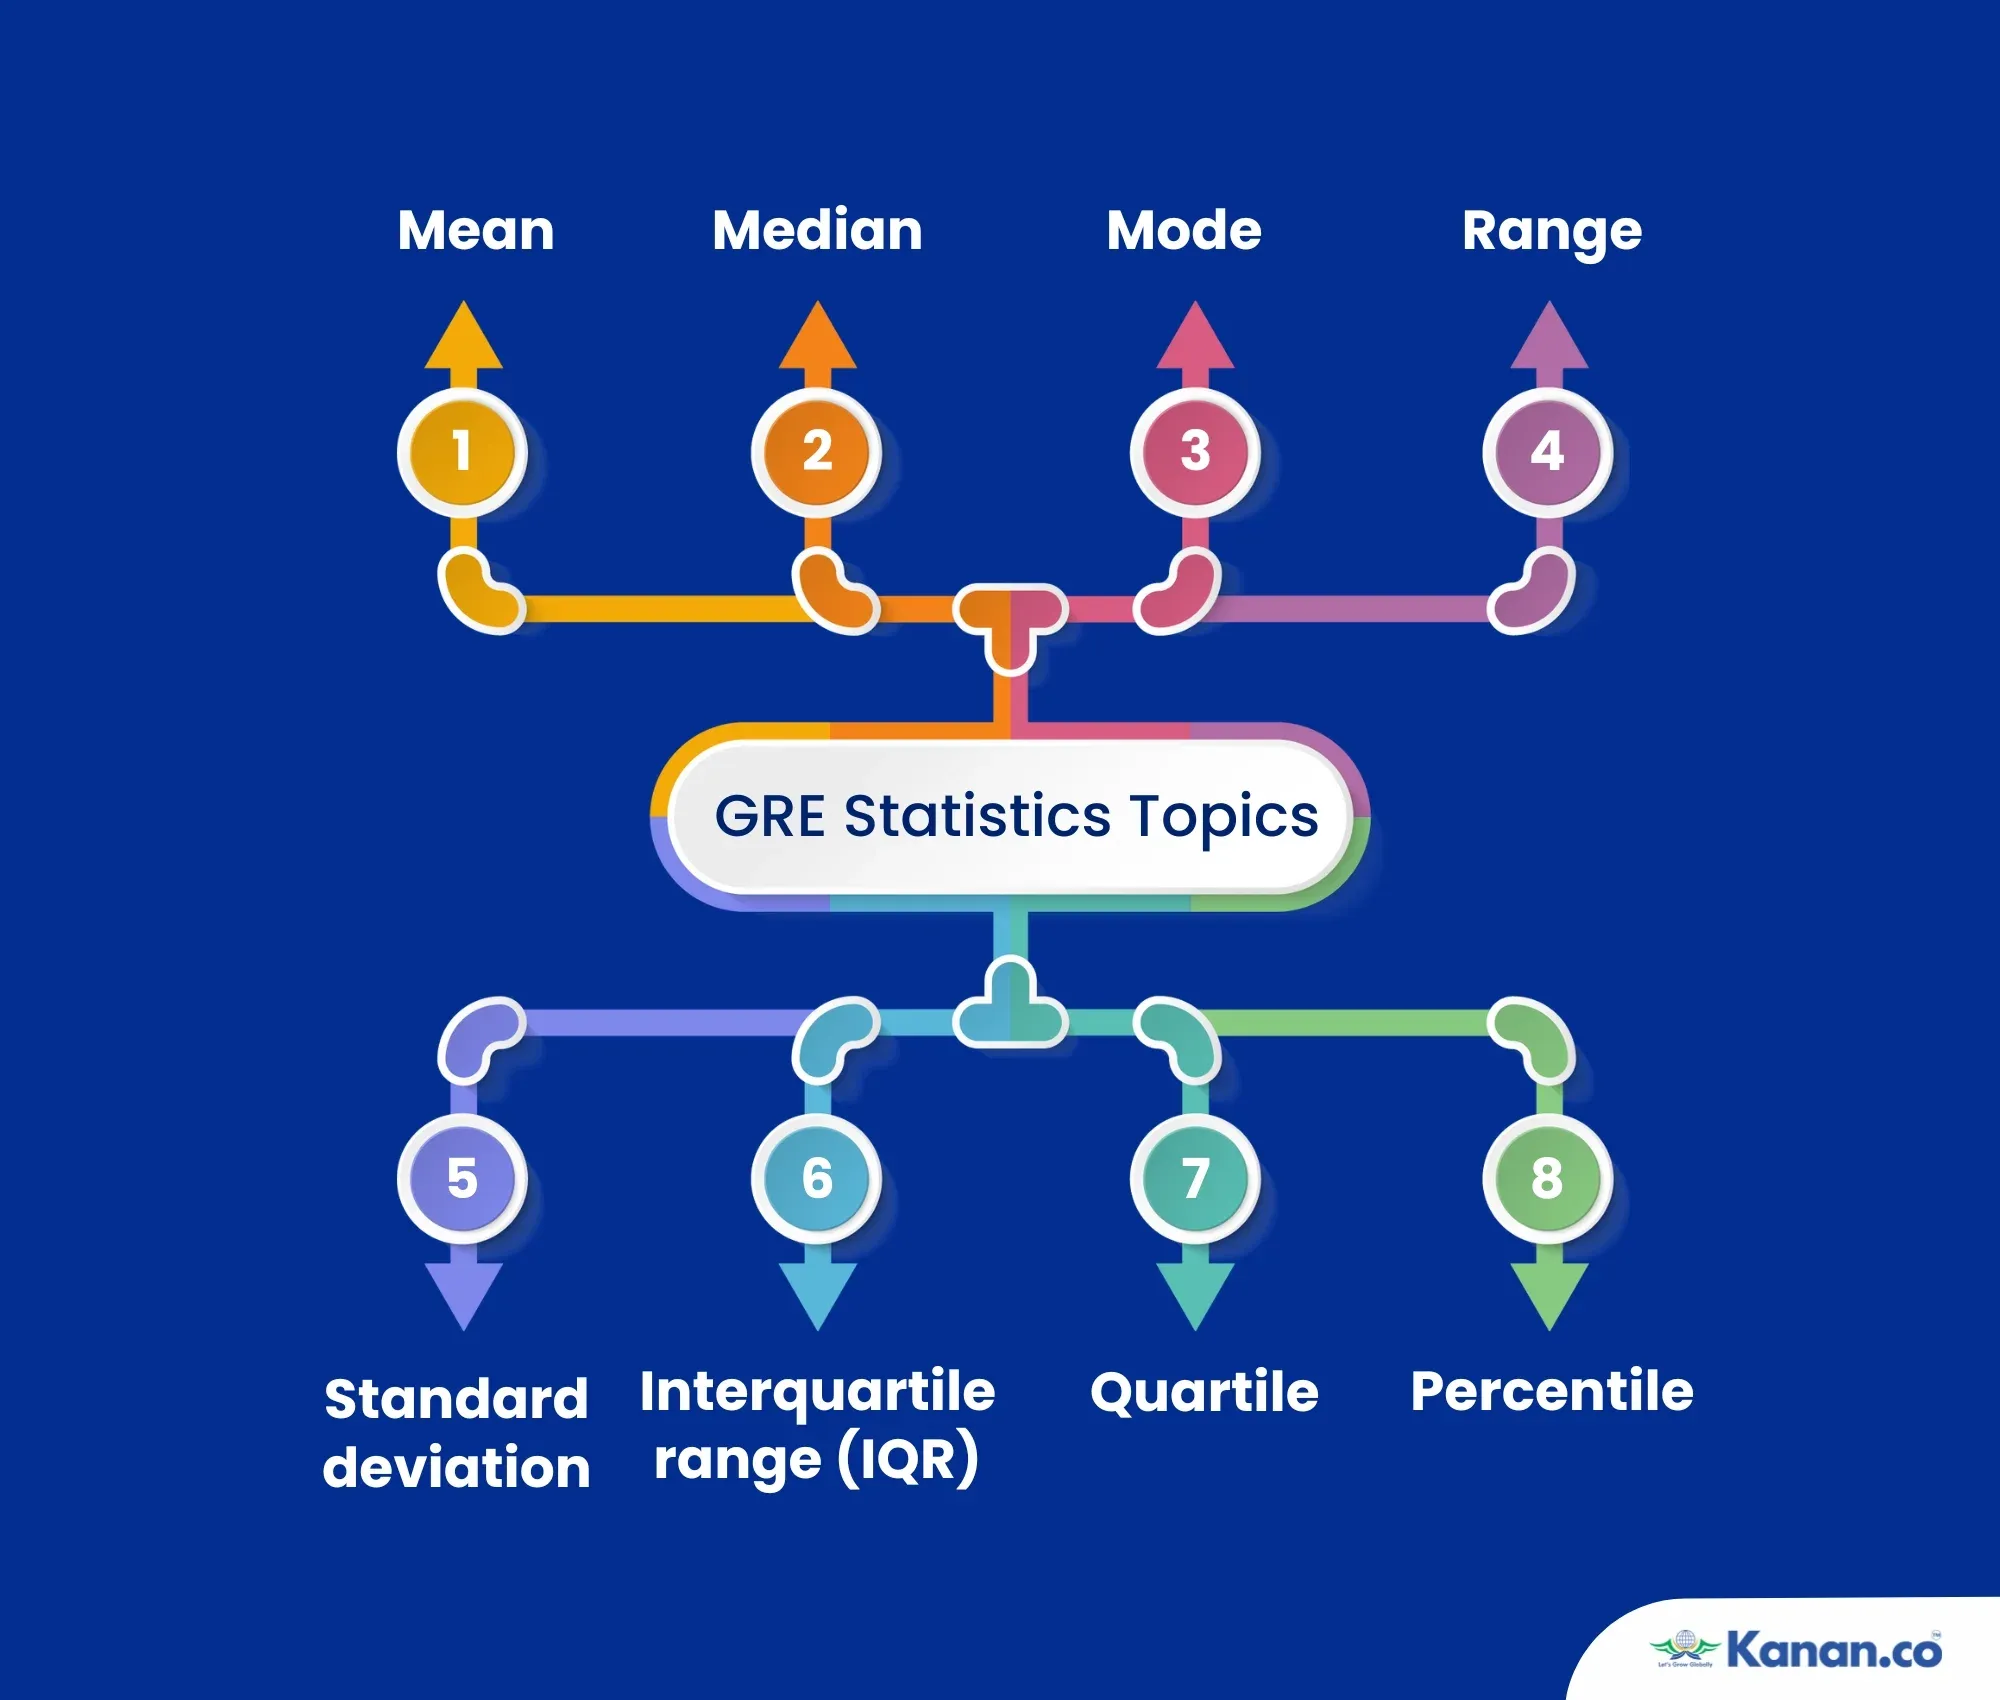
Let's look into each GRE statistics concept in detail, beginning with the topic of Mean.
Mean
Mean can also be known as Average. The average can be calculated by getting the sum of the data and dividing it by the number of data values.
The mean formula is,
Mean = Sum of all data values
Number of data values
For example: How to find Mean?
Question: A teacher recorded the test scores of 10 students in her class as follows: 82, 76, 91, 68, 85, 74, 93, 88, 77, and 81. Calculate the mean test score and explain the steps involved in finding the mean.
Solution:
To find the mean value, apply the given test score and no of data values in the mean formula,
Mean = Sum of all data values
Number of data values
Mean = 82 + 76 + 91 + 68 + 85 + 74 + 93 + 88 + 77 + 81 = 815 = 81.5
10 10
Mean = 81.5
Explanation:
- To find the mean (average), add the number of values.
- Then divide it by the total number of data values.
- And you will get the mean (average) value of the problem.
Hope you now understand how to find the mean value when you get this type of problem in the actual GRE test. Next, we will discuss the Median concept.
Median
The median is the midpoint, middle, or centre of the set of numbers arranged in order. Consider the given set of numbers as n. First, the given set of numbers should be arranged in an ascending order. Then,
If n is odd: median = middle number
If n is even: median = average of 2 middle numbers
For instance: How to find the Median?
Question: A researcher recorded the weights (in kg) of 9 participants in a study as follows: 72, 85, 77, 64, 90, 69, 75, 80, and 73. Calculate the median weight for the odd number of data points. Then, imagine the researcher removing the highest weight (90 kg), making the data set have an even number of weights. Recalculate the median for this even-numbered set.
Solution:
Example 1: Median for Odd Number of Data Points - 72, 85, 77, 64, 90, 69, 75, 80, 73
Arrange the weights in ascending order.
64, 69, 72, 73, 75, 77, 80, 85, 90
There are 9 weights (in kg) in total. So the n value is odd. Then finding the median is very simple. The middle value of the above arranged set of weight values is 75.
So, the Median = 75
Example 2: Median for Even Number of Data Points by eliminating the highest weight 90 - 72, 85, 77, 64, 69, 75, 80, 73
64, 69, 72, 73, 75, 77, 80, 85
The weights are already in ascending order.
Now there are 8 weights (an even number). To find the median, look for the 2 middle weights. Then, the median is the average of the 4th and 5th weights.
Median = 73+75 = 148 = 74
2 2
Thus, the Median = 74
This is how to find the median for odd and even types of questions. Hope the above examples help you understand the median concept well. Next, we’ll move on to the Mode.
Mode
Compared to Mean and Median concepts, mode is very simple and easy to understand and solve. The mode in a list of numbers is the value that shows up most frequently. For example, if '3' shows most often in a list, '3' is the mode. A list can have multiple modes if two or more numbers appear equally often. If each number appears only once, the set has no mode or every number is considered a mode.
For example: How to find Mode?
Question: A manager analysed the number of articles written by the 6 writers over 3 months as follows: 6, 4, 5, 4, 3, 4. Calculate the mode.
Solution:
{6, 4, 5, 4, 3, 4}
In this set of numbers, the most frequently repeated number is 4.
Thus, the Mode = 4.
If this is your set of numbers - {2, 2, 2, 7, 4, 8, 3, 5, 5, 5}
Then the Mode = 2 and 5
If this is your question - {3, 5, 7, 9}
In this case, the Mode = 3, 5, 7, and 9
And that’s all mode is. Further, we discuss the range in the next section.
Range
Range is the difference between the maximum and minimum values in the given data set. Subtract the lowest number from the highest number of the given set of data values.
Formula for Range
Range = Maximum - Minimum
For instance: How to find Range?
Question: A gardener calculates the heights (in cm) of 10 different plant species as follows: 35, 42, 38, 47, 50, 37, 46, 52, 44, and 39. Calculate the range of the plant heights.
Solution:
35, 42, 38, 47, 50, 37, 46, 52, 44, 39
Her, Maximum = 52 cm and Minimum = 35 cm
Range = Maximum - Minimum
= 52 - 35
= 17
Thus, Range = 17cm
Isn’t finding a range easy? Alright! Let’s move on to the next concept which is standard deviation.
Standard deviation
Standard deviation (SD) is obtained by getting the square root of variance. This is the effective measure of how far the other values are from the mean of the data set.
For example: How to find Standard deviation?
Question: The scores in the Mathematics scored by the 8 students in 12th grade are as follows: 86, 68, 70, 80, 92, 85, 90, and 95
Solution:
1. Firstly calculate the mean value
Mean = 86 + 66 + 70 + 80 + 92 + 85 + 90 + 95 = 664 = 83
8 8
Mean = 83
2. Calculate Each Score's Deviation from the Mean:
- 86 - 83 = 3
- 66 - 83 = -17
- 70 - 83 = -13
- 80 - 83 = -3
- 92 - 83 = 9
- 85 - 83 = 2
- 90 - 83 = 7
- 95 - 83 = 12
3. Next, square Each Deviation:
- 32 = 9
- (17)2 = 289
- (-13)2 = 169
- (-3)2 = 9
- 92 = 81
- 22 = 4
- 72 = 49
- 122 = 144
4. Now, calculate the mean of these squared deviations (Variance)
Variance = 9+289+169+9+81+4+49+144 = 754 = 94.25
8 8
Variance = 94.25
5. Finally, find the square root of the variance
Standard deviation (SD) = √94.25 ≈ 9.7
The above are the steps to calculate the standard deviation (SD). I hope you understand the methods of finding SD. Let’s move on to the Interquartile range.
Interquartile range
The interquartile range (IQR) is a measure used in statistics to describe the spread of the middle 50% of a dataset. IQR is the difference between the upper quartile (Q3) and the lower quartile (Q1).
Here's how you can find it:
- Arrange your data in ascending order.
- The first quartile (Q1) is the median of the lower half of the data (excluding the median if the number of observations is odd).
- The third quartile (Q3) is the median of the upper half of the data (excluding the median if the number of observations is odd).
- Subtract Q1 from Q3.
Formula for Interquartile range (IQR)
IQR=Q3−Q1
For example: How to find the Interquartile Range?
Let's calculate the IQR for the following dataset:
2, 6, 8, 9, 13, 15, 25, 16, 18
Let’s arrange the dataset in ascending order:
2, 6, 8, 9, 13, 15, 16, 18, 25
Now, from this ascending order dataset, we have to find the Median (Q2), the lower half (Q1) and the upper half (Q3).
Firstly, let’s find the Median (Q2): Since we have 9 data points, the median is the 5th value:
Median (Q2) = 13
Median (Q2) =13
After finding the median (Q2), let’s find the lower half (Q1) and upper half (Q3).
To find Q1 and Q3, split the ascending order dataset into two halves:
Lower half (below the median): 2, 6, 8, 9
Upper half (above the median): 15, 16, 18, 25
Find Q1 (First Quartile): The median of the lower half:
Q1 = 6+8 = 14 = 7
2 2
Q1 = 7
Find Q3 (Third Quartile): The median of the upper half:
Q3 = 16+18 = 34 = 17
2 2
Q3 = 17
Now, let's find IQR
IQR = Q3 - Q1
= 17 - 7
= 10
Thus, Interquartile Range (IQR) = 10
Quartiles
Quartiles divide a dataset into four equal parts. While the median divides the dataset into two halves, each of these halves is further divided into two quartiles.
Lower Quartile (Q1): The lower quartile, Q1, represents the middle value of the lower half of the dataset. It is also known as the 25th percentile, indicating that 25% of the data points fall below Q1.
Upper Quartile (Q3): Conversely, the upper quartile, Q3, denotes the middle value of the upper half of the dataset. This quartile marks the 75th percentile, meaning 75% of the data points lie below Q3.
For example: How to find Quartile?
Imagine a dataset of test scores: 48, 55, 60, 75, 80, 95, 85, 70
Firstly, arrange the dataset in ascending order: 48, 55, 60, 70, 75, 80, 85, 95
Next, find the median (Q2):
Median (Q2) = (70 + 75) = 145 = 72.5
Q2 (median) = 72.5
Next, Q1 (lower quartile):
Q1 = Median of the lower half = (55 + 60) = 115 = 57.5
2 2
Q1 (lower quartile) = 57.5
Then, Q3 (upper quartile):
Q3 = Median of the upper half = (80 + 85) = 165 = 82.5
2 2
Q3 (upper quartile) = 82.5
Percentile
Percentiles are statistical measures that indicate the value below which a specified percentage of observations fall in a dataset. For example, the 10th percentile represents the value below which 10% of the data points lie.
For instance: How to find the Percetile?
Consider a dataset of exam scores: 70, 55, 85, 65, 60
Arrange the above data set in ascending order
55, 60, 65, 70, 75
Calculate the position for the 50th percentile
P = 50 (50th percentile)
n = 5 (5 scores in the dataset)
Position = (P/100)* (n+1)
= (50/100)* (5+1)
= (50/100)* (6)
= 0.5 * 6
= 3
Interpret the position: 3 means the 50th percentile is at the 3rd position in the ordered dataset.
Now, it is clear that the 50th percentile corresponds to the value at the 3rd position in the ordered dataset which is 65.
Therefore, 50% of the data points in this dataset are at or below 65.
GRE Statistics: Practice Questions with Answers
Attempt the practice questions of GRE statistics and averages provided below. After attempting the questions, verify your answers instantly by referring to the solutions section next to the Practice questions.
1. The daily temperatures, in degrees Fahrenheit, for 10 days in May were 61, 62, 65, 65, 65, 68, 74, 74, 75, and 77.(a) Find the mean, median, mode, and range of thetemperatures.
Temperatures?
2. The numbers of passengers on 9 airline flights were 22, 33, 21, 28, 22, 31, 44, 50, and 19. The standard deviation of these 9 numbers is approximately equal to 10.2.
(a) Find the mean, median, mode, range, and interquartile range of the 9 numbers.
(b) If each flight had had 3 times as many passengers, what would have been the mean, median, mode, range, interquartile range, and standard deviation of the nine numbers?
(c) If each flight had had 2 fewer passengers, what would have been the interquartile range and standard deviation of the nine Numbers?
3. A group of 20 values has a mean of 85 and a median of 80. A different group of 30 values has a mean of 75 and a median of 72.
(a) What is the mean of the 50 values?
(b) What is the median of the 50 values?
4. Find the mean and median of the values of the random variable X, whose relative frequency distribution is given in the table in Data Analysis
| X | Relative Frequency |
| 0 | 0.18 |
| 1 | 0.33 |
| 2 | 0.10 |
| 3 | 0.06 |
| 4 | 0.33 |
5. Eight hundred insects were weighed, and the resulting measurements, in milligrams, are summarised in the boxplot in Data Analysis Figure 25 below.
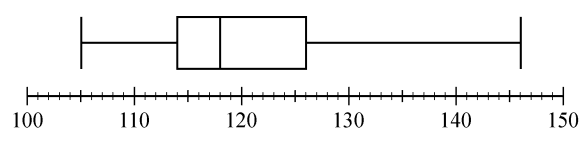
(a) What are the range, the three quartiles, and the interquartile range of the measurements?
(b) If the 80th percentile of the measurements is 130 milligrams, how many measurements are between 126 milligrams and 130 milligrams?
Solution for the GRE Statistics Practice Questions
1. In degrees Fahrenheit, the statistics are
(a) mean = 68.6, median = 66.5, mode = 65, range = 16
(b) mean = 75.6, median = 73.5, mode = 72, range = 16
2. (a) mean = 30, median = 28, mode = 22, range = 31, interquartile range = 17
(b) mean = 90, median = 84, mode = 66, range = 93, interquartile range = 51
Standard Deviation = 3 √940/9 ≈ 30.7
(c) interquartile range = 17, = standard deviation ≈ 10.2
3. (a) mean = 79
(b) The median cannot be determined from the information
given.
4. mean = 2.03, median = 1
5. (a) range 41, Q1 = 114, Q2 = 118, Q3 = 126, interquartile range = 12
(b) 40 measurements
Download the GRE statistics PDF for future reference.
Conclusion
In wrapping up, excelling in GRE statistics is key to scoring high in GRE Quantitative Reasoning. Learning the basics is a good start, however, regular practice with challenging questions is essential to score high percentiles. This aids you to enhance your understanding and sharpens your problem-solving skills. Start your practice today with our provided practice exercises to achieve a competitive GRE score in Quantitative Reasoning. Begin your preparation with our GRE coaching in Chennai. Choosing Kanan International means selecting the best coaching classes for GRE

About Author Manimegalai Samidurai
Manimegalai is a multifaceted professional, excelling as an author, writer, and study-abroad expert. Her vast knowledge of English proficiency exams, including IELTS, GRE, SAT, and PTE, and exceptional content writing skills make her a go-to resource for students seeking guidance and support in their foreign education journey. She is a trusted authority in writing content related to these test-prep exams, making her an invaluable resource for those seeking guidance. With her well-researched and informative blogs, articles, and study materials, Manimegalai has helped countless students achieve their desired band scores and get admissions to top-notch colleges & universities in countries like Canada, USA, UK, Australia, Ireland, etc.
Kanan.co is a trusted study abroad consultancy offering comprehensive services, resources, and solutions for students and education institutions. We support students at every stage of their global education journey, ensuring a smooth and guided experience. Along with test preparation for IELTS, GRE, TOEFL, and SAT, we provide expert services such as SOP writing, visa guidance, accommodation support, scholarship assistance, and education loan support. Our expertise and commitment to excellence make us a reliable partner for students pursuing international education.
Sign Up for a Free GRE Demo Class!
Ace GRE Quant & Verbal with 320+ Score — Join Us!








Global Headquarters
Kanan Int EdTech Inc
320 Bay Street, Suite 321 (Spaces), Toronto ON, Canada M5B 1N9
Indian Headquarters
Kanan International Pvt. Ltd.
D-wing, 2nd Floor, Trident Complex, Ellora Park Vadiwadi Road, Vadodara, Gujarat 390007
IT/ Digital Campus
Kanan International Pvt. Ltd
Old, New No 3, 2nd Floor, 1A, Dr Sadasivam Rd, T. Nagar, Chennai, Tamil Nadu 600017
Our branches
- Bardoli
- Bharuch
- Chennai
- Dehradun
- Gurugram
- Himatnagar
- Karnal
- Nadiad
- Navsari
- Palanpur
- Rajkot
- Vadodara
- Valsad
- Vallabh Vidyanagar
- Vapi
Study Abroad
Test Prep
Top Universities
Consultants
IELTS Centers
GRE Centers
TOEFL Centers
SAT Centers
Language Courses in Vadodara
SOP Blogs
Featured Blogs
Study Abroad Consultants in Chennai
Study Abroad Consultants in Surat
Study Abroad Consultants in Navsari
Study Abroad Consultants in Bardoli
Study Abroad Consultants in Ahmedabad
Study Abroad Consultants in Anand
Study Abroad Consultants in Khanna
Study Abroad Consultants in Nadiad
Study Abroad Consultants in Vadodara
Study abroad consultants in Valsad
Copyright © 2026 KANAN.CO All rights reserved.