- Study Abroad
- / gre
- / venn diagrams
GRE Venn Diagrams: Basics and Practice Questions


Author
11-12-2024

A Venn Diagram is a visual tool in GRE math that represents relationships between sets, using overlapping circles to illustrate common (intersection) and combined elements (union). This concept is essential for GRE quantitative reasoning, especially in set theory and probability questions. GRE Venn Diagrams help categorize how groups overlap or connect, which is crucial for solving complex quantitative problems. The union of two or more sets refers to the combination of elements in those sets. It includes all elements that belong to either set A or set B. Union is represented as:
| Union: A ∪ B, Includes all elements in sets A and B. |
The intersection of two or more sets is the overlap, containing only the elements that are common to both sets. Intersection is represented as:
| Intersection: A ∩ B, Includes only elements in both A and B. |
Typically, you can expect 1-2 questions on this topic in the GRE, testing your ability to interpret and analyze data within sets. This article will cover the basics of GRE Venn Diagrams, explore intersections and unions, and provide practice questions with explanations, preparing you to confidently handle Venn Diagram questions on the GRE.
GRE Venn Diagrams: Intersection and Union with Example
Understanding Venn Diagrams is essential for solving set-related problems, especially in the GRE quantitative reasoning section. GRE Venn diagrams visually represent relationships between different sets, focusing on concepts like union and intersection. The table below highlights the differences between union and intersection.
| Concept | Union (A ∪ B) | Intersection (A ∩ B) |
| Definition | The set of elements in either set A, set B, or both. | The set of elements common to both set A and set B. |
| Example Sets | A = {1, 2, 3}, B = {2, 3, 4} | A = {1, 2, 3}, B = {2, 3, 4} |
| Result | A ∪ B = {1, 2, 3, 4} | A ∩ B = {2, 3} |
| Visual | Represents all areas covered by both circles. | Represents the overlapping area of the circles. |
| Size | The size (number of elements) can be equal to or greater than the size of either set. | The size is always less than or equal to the smaller of the two sets. |
| Inclusion | Includes all unique elements from both sets. | Includes only those elements that are in both sets. |
| Application | Useful for problems involving total counts or combinations. | Useful for problems requiring commonality or shared characteristics. |
| Symbol | Represented by the symbol "∪", which looks like the letter "u". | Represented by the symbol "∩", which looks like the letter "n". |
| Properties | Associative: (A ∪ B) ∪ C = A ∪ (B ∪ C) |
Associative: (A ∩ B) ∩ C = A ∩ (B ∩ C) |
| Commutative | Commutative: A ∪ B = B ∪ A |
Commutative: A ∩ B = B ∩ A |
| Complement | The complement of a union can be expressed as: (A ∪ B)′ = A′ ∩ B′ |
The complement of an intersection can be expressed as: (A ∩ B)′ = A′ ∪ B′ |
| Real-World Examples | Combining groups of people (e.g., students in different classes). | Finding common interests between two groups. |
Example
In the below image you can see two sets:
- Set A represents students who are taking Math.
- Set B represents students who are taking English.
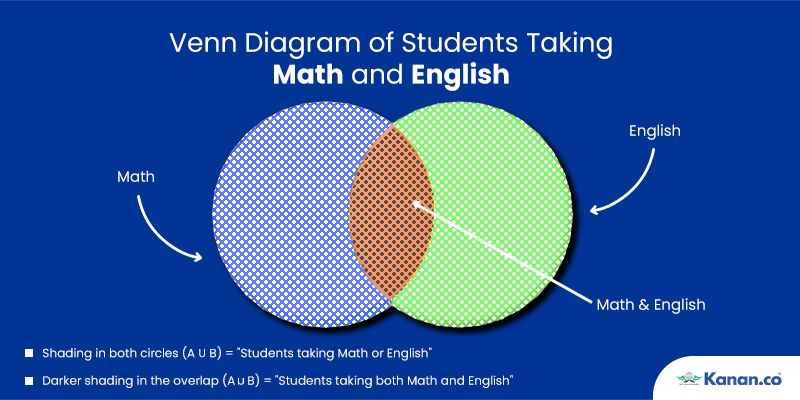
- Union (A ∪ B): If we look at the union, it includes all students taking either Math, English, or both subjects. This represents the combined elements of both sets A and B.
- Intersection (A ∩ B): For the intersection, we’re only interested in students who are taking both Math and English. This represents the shared elements between sets A and B.
In a GRE problem, you might be asked to find the number of elements in the union or intersection of two sets based on given data. This example demonstrates the foundational approach for understanding these relationships in Venn Diagrams.
GRE Venn Diagrams Practice Questions with Answers
Below are practice questions for GRE Venn Diagrams that will help strengthen your understanding of set theory concepts like union and intersection. Each question includes detailed answers to guide you through effective problem-solving techniques.
Example Question #1
In a group of students, 20 students like reading, 18 students like painting, and 12 students don’t like either activity. If there are 40 students in total, how many students like both reading and painting?
Possible Answers:
- 10
- 12
- 2
- 6
- 4
Correct Answer:
6
Explanation:
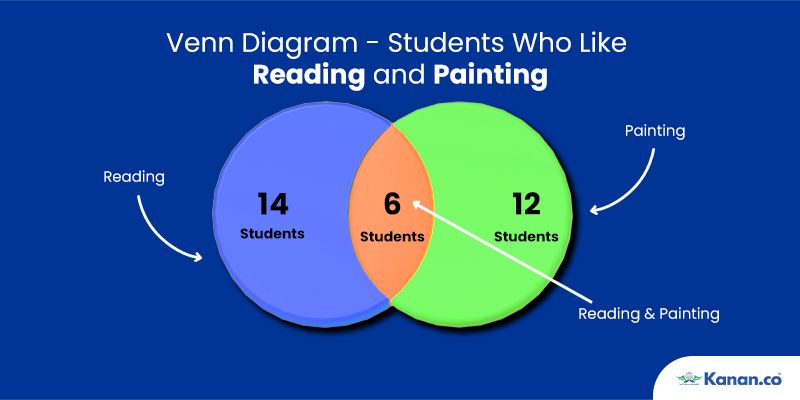
To find the number of students who like both reading and painting, we can use the Venn Diagram approach. The students who like neither activity (12) are outside the circles of the Venn Diagram, leaving us with a total of 40 - 12 = 28 students who like either reading, painting, or both.
The Venn Diagram circles for reading and painting must therefore sum to 28, with one circle representing reading and the other representing painting. We know:
- The total number of students who like reading (including those who may also like painting) is 20.
- The total number of students who like painting (including those who may also like reading) is 18.
Using the inclusion-exclusion principle:
(Reading ∪ Painting) = (Reading) + (Painting) − (Reading ∩ Painting)
Since Reading ∪ Painting)} = 28 (students who like either activity), we plug in values:
28 = 20 + 18 − (Reading ∩ Painting)
Solving for (Reading ∩ Painting):
28 = 38 − (Reading ∩ Painting)
(Reading ∩ Painting) = 38 − 28 = 6
Answer:
6 students like both reading and painting.
Example Question #2
In a population of dogs, 12% are golden retrievers, 6% are vaccinated, and 4% are both golden retrievers and vaccinated. What is the probability that a dog is a golden retriever but not vaccinated?
Possible Answers:
- 10%
- 6%
- 8%
- 12%
- 4%
Correct Answer:
8%
Explanation:
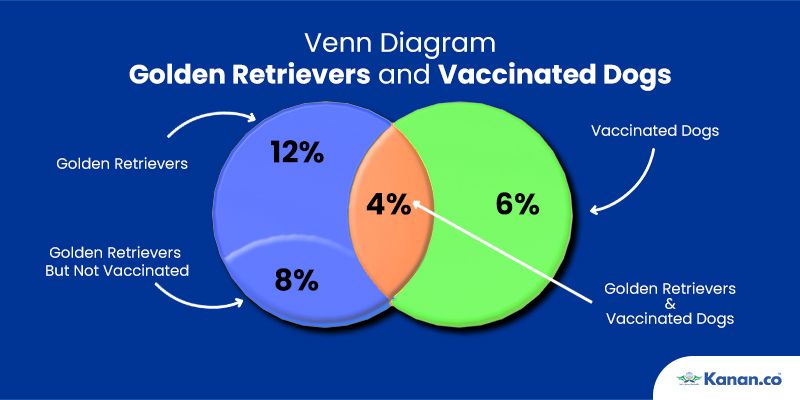
To solve this problem, let’s use a Venn Diagram to visualize the information. We have two main groups:
- Golden retrievers: Represented by 12% of the population.
- Vaccinated dogs: Represented by 6% of the population.
There’s an overlap between these two groups where 4% of the dogs are both golden retrievers and vaccinated.
- Understanding the Setup with Venn Diagrams:
- In the above venn diagram there are two overlapping circles. The first circle represents the set of golden retrievers, and the second represents vaccinated dogs.
- The overlapping area (intersection) between the circles represents the 4% of dogs who are both golden retrievers and vaccinated.
- Finding "Golden Retriever but Not Vaccinated":
- We are asked to find the probability of a dog being a golden retriever but not vaccinated.
- To calculate this, we take the probability of a dog being a golden retriever (12%) and subtract the probability of a dog being both a golden retriever and vaccinated (4%).
- Probability (Golden Retriever but Not Vaccinated) = Probability (Golden Retriever) - Probability (Golden Retriever and Vaccinated)
= 12% - 4%
= 8%
So, the probability that a dog is a golden retriever but not vaccinated is 8%.
Example Question #3
In a company of 2000 employees, 1200 employees have business degrees. 30% of those with business degrees also have finance degrees. This group of employees with both business and finance degrees makes up half of the total employees with finance degrees. How many employees have majors other than business and finance?
Solution:
- Calculate the Intersection (Employees with Both Business and Finance Degrees):
- 30% of the 1200 employees with business degrees also have finance degrees.
- Therefore, the number of employees with both business and finance degrees is: 1200 × 0.30 = 360
- Calculate the Total Number of Finance Majors:
- The problem states that employees with both business and finance degrees make up half of the total finance majors.
- Thus, we can set up the equation: ½ × (Total Finance Majors) = 360
- Solving for the total finance majors: Total Finance Majors= 360 × 2 = 720
- Calculate Employees with Only Business and Only Finance Degrees:
- The total number of business majors is 1200, and 360 of them also have finance degrees.
- Therefore, the number of employees with only business degrees is: 1200 - 360 = 840
- The total number of finance majors is 720, and 360 of them also have business degrees.
- Therefore, the number of employees with only finance degrees is: 720 - 360 = 360
- Calculate the Total Number of Employees in Either Business or Finance (Union of Both Sets):
- Add up the only-business majors, only-finance majors, and those with both majors: 840 + 360 + 360 = 1560
- Calculate the Number of Employees with Majors Other than Business or Finance:
- Subtract the total number of employees in business or finance from the total number of employees: 2000 − 1560 = 440
Answer: There are 440 employees with majors other than business and finance.
Example Question #4
In a university, there are 20,000 students. Out of these students, 2,500 are enrolled in both psychology and sociology courses. There are 3,000 total students taking psychology, and 12,000 students are taking neither psychology nor sociology. How many students are taking sociology this term?
Possible Answers:
- None of the other answers.
- 7,500
- 4,000
- 5,500
- 3,500
Explanation:
Let’s go through the solution step-by-step using a Venn diagram.
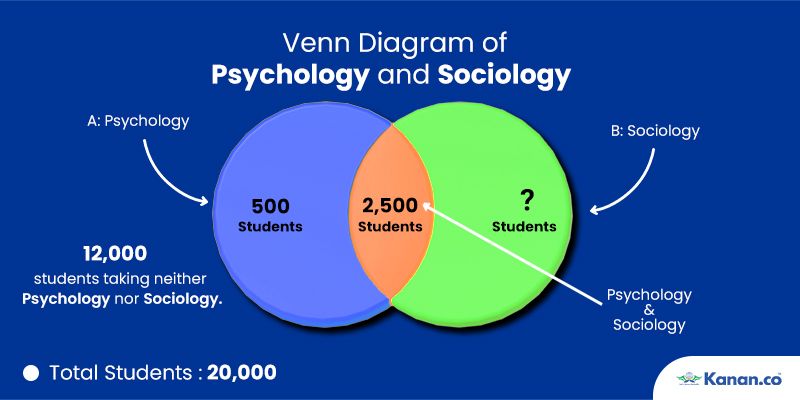
1. Define Variables for Each Set:
- S = Total number of students = 20,000
- A = Total students taking psychology = 3,000
- B = Total students taking sociology (unknown)
- A ∩ B = Students taking both psychology and sociology = 2,500
- Neither A nor B = Students taking neither psychology nor sociology = 12,000
2. Calculate Students Taking At Least One Course (Union of Sets):
Since 12,000 students are taking neither course, the students taking at least one course (psychology or sociology) is:
S − (Neither A nor B) = 20,000 − 12,000 = 8,000
So, 8,000 students are taking either psychology, sociology, or both.
3. Calculate Students Taking Only Psychology:
We know that a total of 3,000 students are taking psychology, and 2,500 of those are also taking sociology.
Therefore, the number of students taking only psychology is:
A − (A ∩ B) = 3,000 − 2,500 = 500
4. Calculate Students Taking Sociology:
To find the total number of students taking sociology, we subtract the number of students taking only psychology from the total taking at least one course:
(Students taking at least one course)−(Students taking only psychology)
= 8,000 − 500 = 7,500
Thus, 7,500 students are taking sociology.
Answer: There are 7,500 students taking sociology.
Example Question #5
There are 500 students in a school. Of those students, 100 are enrolled in Spanish, and 200 are enrolled in French. Some students are enrolled in both languages. There are 300 students who are not enrolled in any language course. How many students are there who are enrolled in at least one language?
Possible Answers:
- 150
- 100
- 200
- 250
- None of the above
Correct Answer: 200
Explanation:
To solve this problem, we use a Venn Diagram to represent the groups.
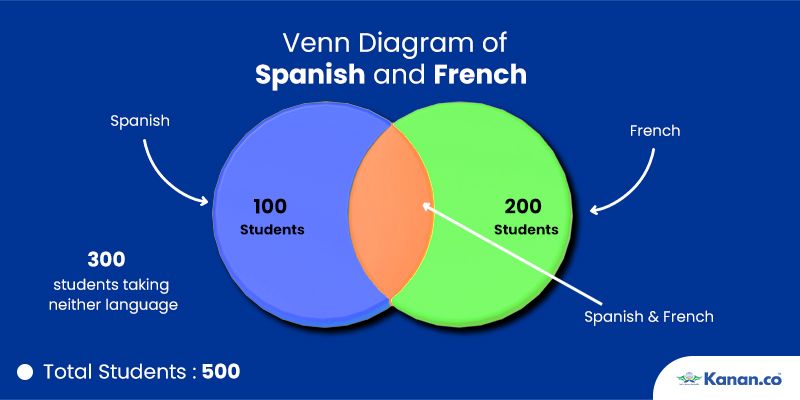
1. Define Variables and Known Values:
- Total students (S) = 500
- Spanish students (A) = 100
- French students (B) = 200
- Neither language = 300
2. Calculate Students Taking At Least One Language:
- We know that 300 students are not enrolled in any language course. Therefore, the number of students taking at least one language is: S−Neither=500−300=200S - \text{Neither} = 500 - 300 = 200S−Neither=500−300=200
- So, 200 students are enrolled in at least one language.
3. Insight into the Venn Diagram:
- Since we’re only asked for the number of students taking at least one language, we don’t need to calculate the exact overlap of students taking both Spanish and French.
Answer: There are 200 students who are enrolled in at least one language.
Example Question #6
In a group of people, m watched only the NBA, 3m watched the NFL, and 15m watched both the NBA and NFL. How many people watched the NBA?
Possible Answers:
- 5
- 15
- 18
- 48
- 30
Solution:
We are tasked with finding how many people watched the NBA.
We are given the following:
- m people watched only the NBA.
- 3m people watched the NFL.
- 15m people watched both the NBA and NFL.
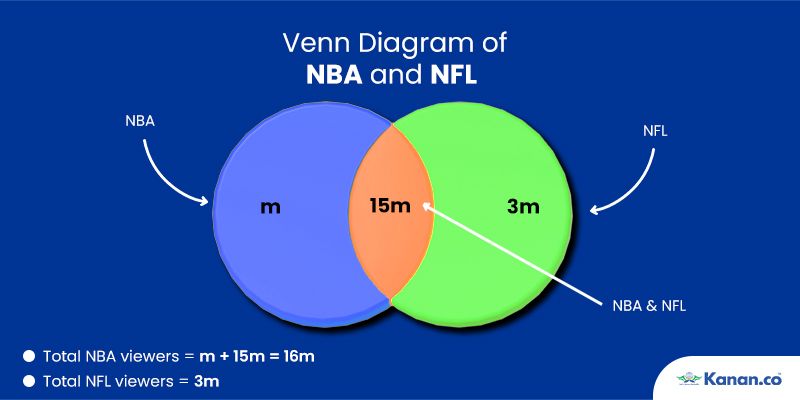
Finding the Possible Values of m:
The total number of people watching the NBA can be divided into two groups: those who watched only the NBA and those who watched both the NBA and NFL. Thus, the total number of people who watched the NBA is:
Total NBA viewers = m + 15m = 16m
Similarly, the total number of people watching the NFL can be divided into those who watched only the NFL and those who watched both but it is already given in the question itself. Thus, the total number of NFL viewers is:
Total NFL viewers = 3m
Since the total number of viewers must be an integer, 15m must be an integer. Therefore, m must be a factor of 15.
Possible values for m:
The factors of 15 are 1, 3, 5, and 15. We will check each possibility.
Case 1: If m = 1
- People watching only the NBA = 1
- People watching the NFL = 3
- People watching both NBA and NFL = 15 * 1 = 15
- Total number of people watching the NBA = 1 (only NBA) + 15 (both) = 16.
- However, 3 people cannot watch the NFL and 15 people both, as the total viewers are less than those who watch both, so m cannot be 1.
Case 2: If m = 3
- People watching only the NBA = 3
- People watching the NFL = 3 * 3 = 9
- People watching both NBA and NFL = 15 * 3 = 45
- Total number of people watching the NBA = 3 (only NBA) + 45 (both) = 48.
- This setup works because the total number of NFL viewers is also consistent with the constraints. Therefore, m = 3 is a valid solution.
Case 3: If m = 5
- People watching only the NBA = 5
- People watching the NFL = 3 * 5 = 15
- People watching both NBA and NFL = 15 * 5 = 75
- Total number of people watching the NBA = 5 (only NBA) + 75 (both) = 80.
- This scenario is consistent, and it works. Therefore, m = 5 is also valid.
Case 4: If m = 15
- People watching only the NBA = 15
- People watching the NFL = 3 * 15 = 45
- People watching both NBA and NFL = 15 * 15 = 225
- Total number of people watching the NBA = 15 (only NBA) + 225 (both) = 240.
- This setup works, so m = 15 is a valid solution.
Conclusion:
The number of people who watched the NBA is either 16, 48, 80, or 240. Therefore, the correct answer is 48 as the valid solution from the choices.
Example Question #7
In a class of 150 students, 60 students are part of the Drama Club and 75 students are part of the Music Club. If 20 students are part of both clubs, how many students are not part of either club?
Possible Answers:
- 45
- 35
- 50
- 55
- Not enough information to answer the question
Correct Answer: 50
Explanation:
To find out how many students are not part of either club, we start by finding the total number of students who are part of at least one club.
Add the students in each club: 60 + 75 = 135
Since 20 students are in both clubs, we have counted them twice. So, we subtract 20 to avoid double-counting.
135 - 20 = 115
This means that 115 students are in at least one club.
Find students not in any club:
There are 150 students in total, so we subtract those who are in at least one club to find those who are in neither club.
150 - 115 = 50
Therefore, 50 students are not part of either club.
Example Question #8
At a university with 12,000 students, 1,200 students are taking both psychology and sociology courses. There are a total of 2,500 students taking psychology. Additionally, 7,000 students are not taking either of these courses. How many students are taking sociology?
Possible Answers:
- None of the other answers
- 3,500
- 2,300
- 4,000
- 2,800
Correct Answer: 4,000
Explanation:
The easiest way to understand this problem is by drawing a Venn Diagram.
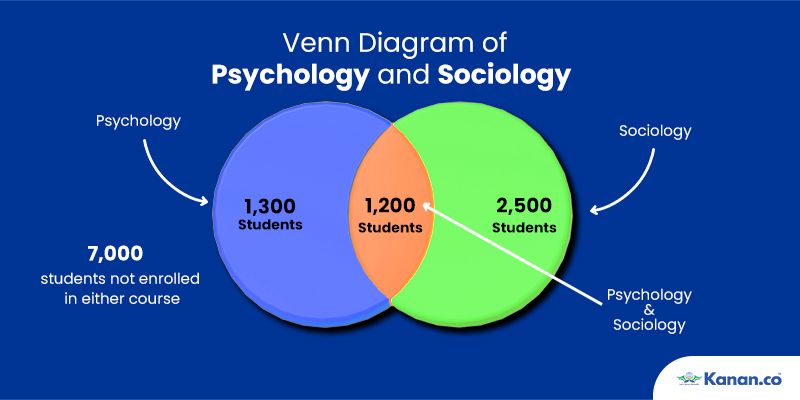
Let,
- S = Total number of students = 12,000
- A = Students taking psychology = 2,500
- B = Students taking sociology
- A ∩ B = Students taking both psychology and sociology = 1,200
- Neither = Students taking neither course = 7,000
Calculate Total Students Taking At Least One Course (A ∪ B):
If 7,000 students are taking neither course, then the number of students taking at least one of the courses is: 12,000 - 7,000 = 5,000
Calculate Students Taking Only Psychology:
There are 2,500 students taking psychology, but 1,200 of those are also taking sociology.
So, the number of students taking only psychology is: 2,500 - 1,200 = 1,300
Calculate Students Taking Sociology (B):
Since we know there are 5,000 students taking at least one of the courses, we subtract those taking only psychology: 5,000 - 1,300 = 3,700
Thus, the total number of students taking sociology is 3,700.
Example Question #9
A gym has 200 members. Of those members, 80 participate in yoga classes, 120 participate in pilates classes, and 60 do not participate in either. How many members participate in both yoga and pilates?
Possible Answers:
- 40
- 60
- 20
- 80
- Not enough information to answer
Correct Answer:
40
Explanation:
To solve this, we’ll use a Venn Diagram approach.
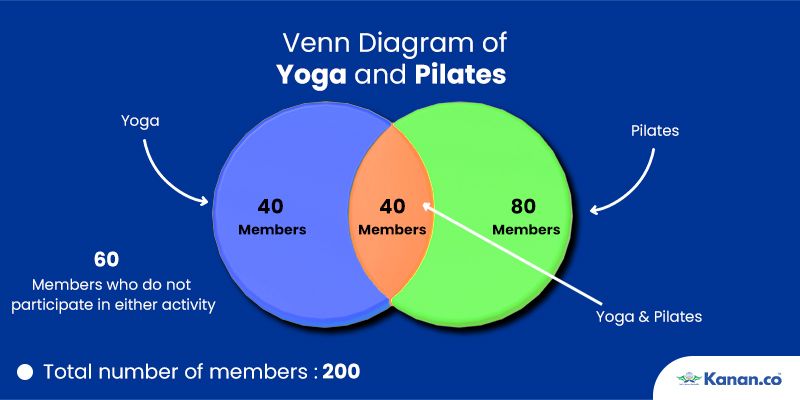
Let:
- Y represents the number of members participating in yoga classes.
- P represents the number of members participating in pilates classes.
- Y ∩ P represents the number of members participating in both yoga and pilates classes.
Given:
- Total members C(Total) = 200
- Members participating in yoga Y = 80
- Members participating in pilates P = 120
- Members participating in neither yoga nor pilates = 60
Calculate the number of members who participate in at least one class:
C(Yoga or Pilates) = C(Total) − C(Neither)
C(Yoga or Pilates) = 200 − 60 = 140
Set up the equation to find the members participating in both classes:
C(Yoga or Pilates) = Y + P − C(Both)
Substitute the known values:
140 = 80 + 120 − C(Both)
Solve for C(Both):
C(Both) = 80 + 120 − 140 = 40
Therefore, 40 members participate in both yoga and pilates.
Example Question #10
A survey was conducted among 150 people on their preferences for three hobbies: reading, painting, and gardening. The data revealed the following:
- 60 people enjoy reading.
- 50 people enjoy painting.
- 70 people enjoy gardening.
- 20 people enjoy both reading and painting.
- 15 people enjoy both painting and gardening.
- 25 people enjoy both reading and gardening.
- 10 people enjoy all three hobbies.
Question
How many people enjoy at least one of these hobbies?
Solution
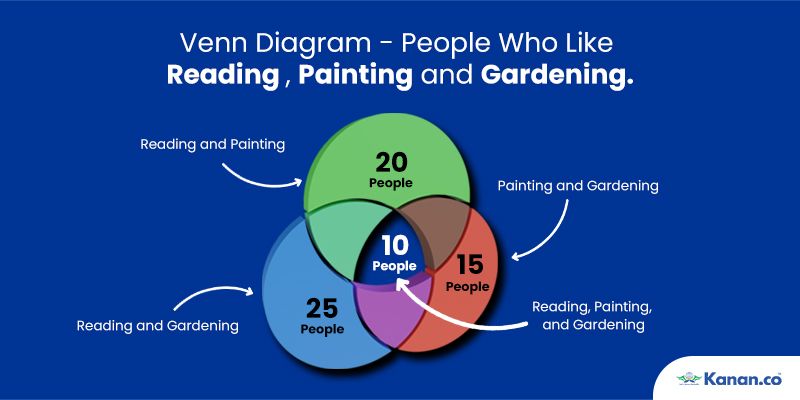
To solve this problem, use the formula for calculating the union of three sets:
∣A∪B∪C∣ = ∣A∣ + ∣B∣ + ∣C∣ − ∣A ∩ B∣ − ∣B ∩ C∣ − ∣A ∩ C∣ + ∣A ∩ B ∩ C∣
Identify known values:
- |A| (Reading) = 60
- |B| (Painting) = 50
- |C| (Gardening) = 70
- |A ∩ B| (Reading and Painting) = 20
- |B ∩ C| (Painting and Gardening) = 15
- |A ∩ C| (Reading and Gardening) = 25
- |A ∩ B ∩ C| (All three hobbies) = 10
Apply the formula:
∣A ∪ B ∪ C∣ = 60 + 50 + 70 - 20 - 15 - 25 + 10 = 130
Thus, 130 people enjoy at least one of the three hobbies.
Example Question #11
A college has 250 students enrolled in either a statistics or a physics class. Out of these students, 140 are enrolled in the statistics class, and 125 are enrolled in the physics class. What is the minimum number of students who could be taking both classes?
Solution:
To solve, let’s use the principle of overlapping sets, where we calculate the minimum number of students in both classes:
- Total students C(Total) = 250
- Students in statistics C(Statistics) = 140
- Students in physics C(Physics) = 125
Since we want to find the minimum overlap, use the formula:
C(Total) = C(Statistics) + C(Physics) − C(Both)
Rearrange to solve for C(Both):
C(Both) = C(Statistics) + C(Physics) − C(Total)
Substitute the values:
C(Both) = 140 + 125 −250 = 15
Thus, the minimum number of students who could be enrolled in both classes is 15.
Key Takeaways on GRE Venn Diagrams
Here are the key points to remember when solving word problems using Venn Diagrams on the GRE.
- Solving word problems with sets and Venn Diagrams requires a clear understanding of how to handle scenarios where two groups may overlap or have shared elements.
- Venn Diagrams are an effective tool for grouping elements, particularly when items can belong to multiple categories at the same time.
- A standard Venn Diagram for two groups features two overlapping circles inside a rectangle, which represent the groups, their intersection, and elements outside both.
- Carefully reading the problem is vital, as small changes in wording can drastically alter how the problem is approached and solved.
- Practice exercises help you practice turning problem statements into Venn Diagrams and then solving the equations that arise from them.
- It’s important to pay attention to wording and use Venn Diagrams as a helpful visual aid for breaking down and solving complex problems.
In conclusion, mastering Venn Diagrams can significantly enhance your ability to solve GRE word problems efficiently. By practising the steps outlined above and paying attention to wording, you'll be well-equipped to handle any set-related question. Remember, GRE Venn Diagrams are powerful tools for simplifying complex problems and ensuring accuracy. If you need expert guidance in refining your GRE skills, Kanan International provides personalized coaching to help you achieve success.
Frequently Asked Questions
1. What is the formula for the Venn diagram?
The formula for the union of two sets, A and B, in a Venn diagram, is:
n (A ∪ B) = n(A )+ n(B) − n(A ∩ B)
This formula helps find the total number of elements in either or both sets by adjusting for the overlap between them.
2. How to find A ∪ B in a Venn diagram?
To find the union of two sets, A and B (denoted as A ∪ B), you add the number of elements in both sets, then subtract the number of elements common to both sets. This ensures that the elements in the intersection aren’t counted twice.
3. How to solve a Venn diagram with 3 circles?
For three sets (A, B, and C), the total number of elements in the union of all sets (A ∪ B ∪ C) can be found by:
n (A ∪ B ∪ C) = n(A) + n(B) + n(C) − n(A ∩ B) − n(A ∩ C)− n(B ∩ C) + n(A ∩ B ∩ C)
This formula ensures you account for all the elements correctly, considering all overlaps between the sets.
4. How do you solve A ∪ B ∪ C?
To solve A ∪ B ∪ C, you apply the 3 circle formula for three sets. You need to add the number of elements in A, B, and C, subtract the numbers of elements in the pairwise intersections (A ∩ B, A ∩ C, and B ∩ C), and then add back the number of elements in the intersection of all three sets (A ∩ B ∩ C).

About Author Sravani Kota
Sravani is an enthusiastic author who is deeply passionate about continuous learning, writing, and reading. Her academic background includes a Bachelor's and Master's degree in engineering from JNTU, gaining expertise in technical English writing, paper publications, test preps like IELTS, GRE, SAT, TOEFL, etc., and study abroad services like SOP, LOR, etc. Her expertise in the education sector makes her an excellent resource for students seeking guidance and advice. In her leisure time, she enjoys spending quality time with family, watching popular TV shows like Stranger Things and Money Heist, and she also loves to travel, explore new places, and create videos of her experiences.
Kanan.co is a trusted study abroad consultancy offering comprehensive services, resources, and solutions for students and education institutions. We support students at every stage of their global education journey, ensuring a smooth and guided experience. Along with test preparation for IELTS, GRE, TOEFL, and SAT, we provide expert services such as SOP writing, visa guidance, accommodation support, scholarship assistance, and education loan support. Our expertise and commitment to excellence make us a reliable partner for students pursuing international education.
Sign Up for a Free GRE Demo Class!
Ace GRE Quant & Verbal with 320+ Score — Join Us!








Global Headquarters
Kanan Int EdTech Inc
320 Bay Street, Suite 321 (Spaces), Toronto ON, Canada M5B 1N9
Indian Headquarters
Kanan International Pvt. Ltd.
D-wing, 2nd Floor, Trident Complex, Ellora Park Vadiwadi Road, Vadodara, Gujarat 390007
IT/ Digital Campus
Kanan International Pvt. Ltd
Old, New No 3, 2nd Floor, 1A, Dr Sadasivam Rd, T. Nagar, Chennai, Tamil Nadu 600017
Our branches
- Bardoli
- Bharuch
- Chennai
- Dehradun
- Gurugram
- Himatnagar
- Karnal
- Nadiad
- Navsari
- Palanpur
- Rajkot
- Vadodara
- Valsad
- Vallabh Vidyanagar
- Vapi
Study Abroad
Test Prep
Top Universities
Consultants
IELTS Centers
GRE Centers
TOEFL Centers
SAT Centers
Language Courses in Vadodara
SOP Blogs
Featured Blogs
Study Abroad Consultants in Chennai
Study Abroad Consultants in Surat
Study Abroad Consultants in Navsari
Study Abroad Consultants in Bardoli
Study Abroad Consultants in Ahmedabad
Study Abroad Consultants in Anand
Study Abroad Consultants in Khanna
Study Abroad Consultants in Nadiad
Study Abroad Consultants in Vadodara
Study abroad consultants in Valsad
Copyright © 2026 KANAN.CO All rights reserved.