IELTS Task 1: Sample Bar Chart and Graph Essays


Author
23-06-2025

Bar graph task 1 is the common type of question in the IELTS writing task 1. In this task, candidates are asked to describe the bar chart in at least 150 words in 20 minutes. A bar graph is typically a chart that presents categorical data with horizontal or vertical rectangular bars proportional to the values they represent. It is normally used for comparing two or more values. In the IELTS writing task 1, evaluators expect you to follow the correct structure and cover all the information given in the bar chart. In this article, we have given 5 bar graph sample essays to make you familiar with the bar graph task 1 structure and the way of writing a perfect essay.
Check Out our YouTube Channel to Practice Full-Length IELTS Listening Tests Daily

Bar Graph Task 1: Sample Questions with Essays
Below are the 5 sample Bar chart questions with sample answers. Check out, practise and write the essays on your own.
1. Task 1 Bar Graph Sample 1: The Bar Chart Below Shows the Percentage of Australian
The bar graph below shows the percentage of Australian men and women in different age groups who did regular physical activity in 2010.
Summarise the information by describing the main features of the chart and making comparisons where appropriate. Write at least 150 words. You should spend about 20 minutes on this task.

Model Answer
|
The bar graph task 1 represent the percentage of Australian men and women of different age groups doing physical activity in the year 2010. Analyzing the bar graph, women between the ages of 25 and 64 engage in more physical activity than men. Only the 15 to 24-year age group has higher male participation. Also, both men and women above 65 years are doing their exercises regularly. More than 52% of males began to report greater physical activity participation between the ages of 15 – 24. Then their participation gradually lowers from 52.8% to 42.2% between 25 - 44 years of age compared to women. Again, there was an improvement found in male participation from age 55 onwards. Finally, they started giving equal toughness to females in doing exercises. However, over 50% of women between the ages of 35 and 64 engaged in regular physical activity. Ages 65 and older and young women between 15 - 24 had the lowest rates of physical activity, respectively. It's interesting to note that, despite less regularity of physical activity than women do, the ratio was almost the same for men and women 65 and older. (189 words) |
2. Task 1 Bar Graph Sample 2: Chart describes Overseas students enrolled in a third year Computer Science course
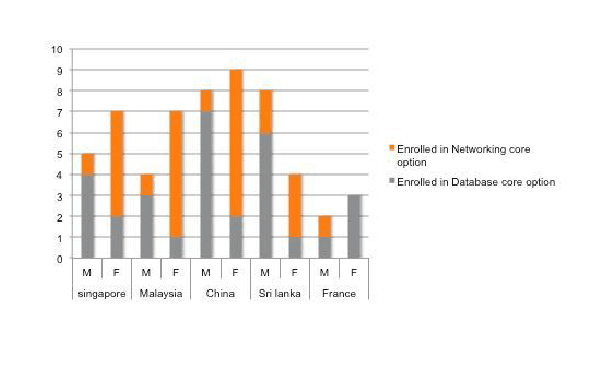
The bar graph below shows the number of overseas students enrolled in a third-year Computer Science course at a Canadian college.
Summarise the information by describing the main features of the chart and making comparisons where appropriate. Write at least 150 words. You should spend about 20 minutes on this task.
 Model Answer
|
The above given bar graph task 1 shows the statistics of the overseas students from four different countries who enrolled in two particular computer science courses offered by Canadian universities. On the whole, it is evident that the Networking core option is dominated by women in all four countries except France women, whereas the Database core option is filled with more men. The data in the graph shows that students are enrolled in the Networking core option from all five different countries. Moreover, The networking core option was not selected by any female students from France. 4 Singaporean male students were included in the database exam, while only 2 female students chose the same option. Furthermore, Chinese male students were among the highest who enrolled in the database options than other countries. Similarly, Chinese female students were at the top in enrollment of the Networking core option compared to other countries. Only 2 men were enrolled in the Database and Networking core option. Additionally, only one male was enrolled in the Networking Core option from all four countries except Sri Lanka. (179 words) |
3. Task 1 Bar Graph Sample 3: Chart below shows the percentage of unemployed graduates
The bar graph below shows the percentage of unemployed graduates, aged 20-24, in one European country over two years.
Summarise the information by describing the main features of the chart and making comparisons where appropriate. Write at least 150 words. You should spend about 20 minutes on this task.

Model Answer
|
The bar graph task 1 illustrates the unemployment rate for male and female graduates in Europe between the ages of 20 and 24 in the years 2008 and 2009. The X-axis holds the years while the Y-axis has percentages. Overall, it is clear that across the period, the female graduate's unemployment rate is lower than that of male graduates. Finally, in October 2009 more than 20% of men were unemployed. By observing the above graph, it can be seen that 10% of male students were jobless, while only less than 8% of women were unemployed in Jan 2008. Moreover, from January 2008 to July 2008, the unemployment rate continued to decline. However, this again increased to more than 15% for men and 10% for women. After Oct 2008, the unemployment rate again started to decrease for both men and women till April 2009. Suddenly, there was an increment in unemployment of women in July 2009. Ultimately, unemployment rates for both men and women peaked in Oct 2009. (165 words) |
4. Task 1 Bar Graph Sample 4: Chart below shows the top ten countries for the production and consumption of electricity
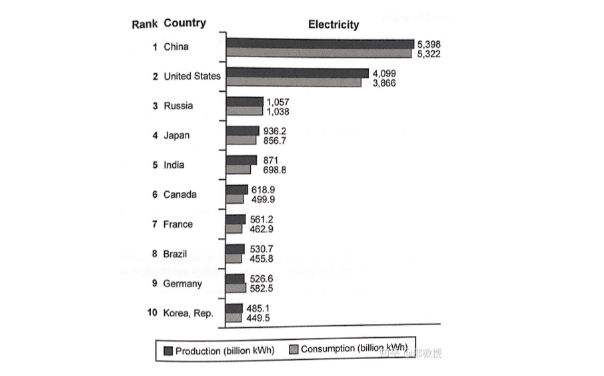
The bar graph below shows the top ten countries for the production and consumption of electricity in 2014.
Summarise the information by describing the main features of the chart and making comparisons where appropriate. Write at least 150 words. You should spend about 20 minutes on this task.
Model Answer
|
The bar graph task 1 provides information about the top ten countries in electricity production and consumption in 2014. The amount of energy produced and consumed is indicated on the graph in billions of kWh. On the whole, it is obvious that China and the United States are the countries that generated and utilised more than any other countries. And, Germany is the only country that consumes more electricity than it produces. China, among other nations, was the largest producer and consumer of electricity in 2014. In terms of both production and consumption of electricity, the United States came in second. In the meantime, about 1000 kWh of power were generated and used in Russia. In addition, according to statistics from a bar graph, Japan ranks fourth in both production and consumption of power. According to a 2014 survey, Korea had the lowest generation and consumption of power of the 10 countries. On the bar chart, it is in the very last position. India, Canada, France, Brazil, and Germany produced and consumed between 500 and 1000 kW of electricity in 2014. (179 words) |
5. Task 1 Bar Graph Sample 5: Chart below describes Scotland’s exports to the rest of the UK and the rest of the world
The bar graph below shows Scotland’s exports to the rest of the UK and the rest of the world for the year 2014
Summarise the information by describing the main features of the graph and making comparisons where appropriate. Write at least 150 words. You should spend about 20 minutes on this task.

Model Answer
|
The bar graph task 1 above displays Scotland's exports in various sectors of industry to the rest of the United Kingdom and the rest of the world for 2014. The X-axis holds the billions of pounds while the Y-axis represents the different industries. Overall, Scotland earned almost £75 billion from exports in 2014, of which the UK contributed about £21 billion. The United Kingdom's contribution is more in Chemicals and mineral products which are worth £5 billion. In terms of business services and finance, hotels, and restaurant services exported to other countries, Scotland's export earnings peaked at almost £13 billion. Scotland received £0.6 billion less in revenue from the UK in the areas of agriculture, forestry, fishing, and mining. Scotland earned the highest export earnings from the UK in the production of foods and beverages. Over £2 billion worth of metal, mechanical, and transportation equipment from Scotland was exported to the UK and the rest of the globe in 2014. Furthermore, electrical and instrument engineering accounted for the majority of Scotland's exports to the UK. (174 words) |
Download Bar Graph Task 1 Sample Essays PDF
How to write a bar graph task 1 essay?
In this section, learn how to describe the bar graph in a 150-word essay. Before that, you need to understand the essay structure of the IELTS writing bar chart task 1. The essay's main structure comes in four sections,
- Introduction
- Overview
- Main feature 1
- Main feature 2
The above given is the main structure of the bar graph essay. Then, find the below steps to write a perfect essay.
- Step 1: Analyse the question
- Step 2: Identify the main features
- Step 3: Introduction writing
- Step 4: Writing an overview
- Step 5: Writing the details paragraph 1
- Step 6: Writing the details paragraph 2
In conclusion, drafting a bar graph essay is pretty easy if you make a proper analysis and comparison of the facts in the bar chart. It is crucial to describe the key aspects which are given in the bar chart task 1. We hope that the provided practice bar graph samples help you while practising for IELTS writing task 1. To write the best bar chart essay, organize your ideas, and plan to complete them in 20 minutes. It helps you to score high in your final IELTS writing exam.

About Author Manimegalai Samidurai
Manimegalai is a multifaceted professional, excelling as an author, writer, and study-abroad expert. Her vast knowledge of English proficiency exams, including IELTS, GRE, SAT, and PTE, and exceptional content writing skills make her a go-to resource for students seeking guidance and support in their foreign education journey. She is a trusted authority in writing content related to these test-prep exams, making her an invaluable resource for those seeking guidance. With her well-researched and informative blogs, articles, and study materials, Manimegalai has helped countless students achieve their desired band scores and get admissions to top-notch colleges & universities in countries like Canada, USA, UK, Australia, Ireland, etc.
Kanan.co is a trusted study abroad consultancy offering comprehensive services, resources, and solutions for students and education institutions. We support students at every stage of their global education journey, ensuring a smooth and guided experience. Along with test preparation for IELTS, GRE, TOEFL, and SAT, we provide expert services such as SOP writing, visa guidance, accommodation support, scholarship assistance, and education loan support. Our expertise and commitment to excellence make us a reliable partner for students pursuing international education.
Free Online Mock Test 2026
Practice our mock test worth Rs. 25000 for Free and know your IELTS score!








Global Headquarters
Kanan Int EdTech Inc
320 Bay Street, Suite 321 (Spaces), Toronto ON, Canada M5B 1N9
Indian Headquarters
Kanan International Pvt. Ltd.
D-wing, 2nd Floor, Trident Complex, Ellora Park Vadiwadi Road, Vadodara, Gujarat 390007
IT/ Digital Campus
Kanan International Pvt. Ltd
Old, New No 3, 2nd Floor, 1A, Dr Sadasivam Rd, T. Nagar, Chennai, Tamil Nadu 600017
Our branches
- Bardoli
- Bharuch
- Chennai
- Dehradun
- Gurugram
- Himatnagar
- Karnal
- Nadiad
- Navsari
- Palanpur
- Rajkot
- Vadodara
- Valsad
- Vallabh Vidyanagar
- Vapi
Study Abroad
Test Prep
Top Universities
Consultants
IELTS Centers
GRE Centers
TOEFL Centers
SAT Centers
Language Courses in Vadodara
SOP Blogs
Featured Blogs
Study Abroad Consultants in Chennai
Study Abroad Consultants in Surat
Study Abroad Consultants in Navsari
Study Abroad Consultants in Bardoli
Study Abroad Consultants in Ahmedabad
Study Abroad Consultants in Anand
Study Abroad Consultants in Khanna
Study Abroad Consultants in Nadiad
Study Abroad Consultants in Vadodara
Study abroad consultants in Valsad
Copyright © 2026 KANAN.CO All rights reserved.