- Study Abroad
- / pte
- / line graph
Line Graph PTE: Describe Image Practice Samples with Answers


Author
01-03-2024


In the Line Graph PTE question type, students are requested to describe the information presented in the image. The PTE describe image task is one of the challenging parts of the Pearson Test of English (PTE) Speaking exam, which assesses the test taker's speaking and writing skills. PTE describe image speaking tasks and also has other question types that include pie charts, line graphs, bar graphs, diagrams, maps, or images.
The main challenge in this task is to provide a clear description of the information within 40 seconds while having only 25 seconds to prepare. In order to perform well on this section,, test-takers must successfully recognize and communicate key concepts and trends using a better vocabulary. This article explains Line Graph PTE, shares effective description tips, and includes practice questions with answers for your PTE preparation.
Structure of Line Graph PTE - Describe Image
When attempting the PTE Describe Image task in an academic setting, you'll often encounter line graphs. To boost your vocabulary and speaking scores, it's essential to follow the suggested format for improving your image descriptions.
Introduction:
Begin your introduction by referencing the title of the diagram. Make sure to highlight the lines and the x-axis which is the primary focus in the graph.
For example: Begin with the line - This line graph indicates annual sales of the showroom from the year 1990-2010.
Description:
Following the introduction, focus on highlighting the highest and lowest points, peaks, valleys, or any remarkable shifts in the lines, which are often referred to as trends. Elaborate on these trends or patterns that you observe, commencing with the X-axis (typically representing time) and then moving to the Y-axis (representing values). Remember that your vocabulary usage will increase your score.
For example: The highest number of students enrolled in
There was a rise in
The lowest sales occurred in this year
Starting with the x-axis denoting the years and the y-axis mentioning the goods sold in the respective years. The highest no of units was sold in 2019 and there was a decrease in sales in the year 2010.
Conclusion :
Conclude the description by restating the major findings in the graph.
For example: In conclusion, the line graph illustrates a noticeable profit in sales over a span of five years, with losses occurring in two of those years.
Line Graph PTE: Practice Samples
To help candidates describe line graphs effectively, a few sample line graphs are provided below with answers.
PTE Describe Image Practice Test 1
In the describe image task, you are allotted 25 seconds for preparation and 40 seconds for speaking. Here is an example of how to describe it.
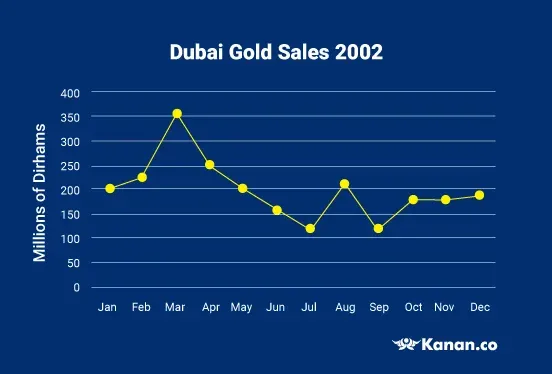
Sample Answer Introduction: This line graph indicates Dubai Gold Sales in 2002 throughout the year measured in millions of dirhams.
Sample Answer Description:
In January, the price was at 200 dirhams. It saw a steep rise from February, reaching 350 million. Subsequently, there was a sharp decline, followed by a slower decrease, ultimately settling at 150 million in July. August marked a brief recovery, with sales hitting 200 million, followed by another decline in September. However, by December, sales nearly returned to 200 million.
Sample Answer Conclusion:
In conclusion, Throughout the year, there were fluctuations, but on the whole, sales remained at approximately 200 million dirhams per month.
Download line graph PTE pdf Sample 1 here.
PTE Describe Image Practice Test 2
There are scenarios where multiple line graph images can be given in a PTE exam. You have 25 seconds to prepare and 40 seconds to describe the image. Below is an example of how to explain multiple line graphs.

Sample Answer Introduction: This line graph indicates the monthly rainfall in millimetres for the major cities of London and Berlin over the course of the year.
Sample Answer Description:
In January, Berlin recorded approximately 43 millimetres of monthly rainfall, while London saw about 50 millimetres. Both cities experienced a decline in February, but during March and April, the rainfall gradually increased. Berlin reached its highest rainfall in June, with around 70 millimetres, while London had 50 millimetres during that time. Berlin experienced a subsequent decrease in rainfall with occasional fluctuations, while London did not reach its peak until October, recording slightly over 65 millimeters.
Sample Answer Conclusion:
In conclusion, Berlin recorded its highest rainfall in June, and London experienced its peak in October. The lowest rainfall for both cities occurred in February.
Download line graph PTE pdf Sample 2 here
PTE Describe Image Practice Test 3
Usually, multiple line graphs cover extensive data, but it's crucial to remember that you only have 40 seconds, so avoid attempting to cover every detail. The key focus should be on comparing the lines and discussing both their similarities and differences. Below is an example of it.

Sample Answer Introduction: This line graph indicates annual sales of hardware and software from the year 1992 to 2002.
Sample Answer Description:
In 1992, 20,000 hardware units and 25,000 software units were sold. Hardware sales showed a steady increase until 1999 when they dropped back to 25,000 units by 2002. In contrast, software sales experienced a sharp rise, returning to their initial 20,000-unit level in 1999.
Sample Answer Conclusion:
In conclusion, Software sales exceeded hardware sales during the 10-year period. The sale performance of hardware is less beneficial except for the noteworthy performance in the year 1999.
Download line graph PTE pdf Sample 3 here
Tips to describe the image of line graph PTE effectively
Improve your PTE speaking and writing scores by learning how to describe line graphs effectively in the test. In this section, we'll share invaluable tips and strategies to help you guide the complexities of presenting line graph data with confidence and clarity.
- Give attention to punctuation and fluency in your speech.
- Avoid over-explaining every detail in the image
- Provide a well-organized description of the image by classifying it into an introduction, main content, and conclusion.
- Focus on speaking for more than 30 seconds to score more than 80 on your PTE exam.
- Set a timer while practicing to describe the image task.
- Give your best effort in describing the image, as it carries significant weight in the PTE Speaking section.
Conclusion
In conclusion, this blog provides you with all the details about line graph PTE, tips to describe the image, and various samples to practice. To excel and achieve a high score in your PTE exam, it's recommended to receive training from experienced instructors. Make sure you don't miss out on the chance to enroll in the PTE Academic Course provided by Kanan. Co.
FAQ
1. What is the line graph in the PTE exam?
The line graph comes under the Speaking section of the PTE test. Students will be asked to describe an image consisting of a single line graph or multiple line graph within 45 seconds in their own words.
2. How do you describe images in the PTE exam?
Describing images effectively in the PTE exam under 40 seconds requires dividing the content into an introduction, a detailed description, and a concluding statement.
3. How do I score high in the PTE describe image?
To score high in the PTE describe image task, here are some effective tips:
- Do not cover all the information in the image. Only focus on delivering the main facts of the image.
- Make sure to speak for more than 30 seconds to score above 80 in the PTE test.
- Focus on your fluency and pronunciation.
- Practice describing the image by setting the timer.
- Provide an organized description that includes an introduction, description, and conclusion.

About Author Sruthi Krishnan
Sruthi Krishnan, an accomplished MBA graduate with an unwavering passion for writing is a recognized expert in Study Abroad Services. With years of experience in the overseas education industry, she specializes in preparing test materials for a wide range of exams, including IELTS, TOEFL, GRE, SAT, PTE, and more. Her expertise extends to providing comprehensive guidance on crafting Statements of Purpose (SOPs), Letters of Recommendation (LORs), and various aspects of study abroad, from exam preparation to admissions procedures. She's an expert in helping study-abroad aspirants through informative articles for study destinations like Canada, the US, the UK, Australia, and more. Her passion for writing has led to the creation of numerous articles that serve as valuable resources for students making critical decisions about their international education journeys.
Kanan.co is a trusted study abroad consultancy offering comprehensive services, resources, and solutions for students and education institutions. We support students at every stage of their global education journey, ensuring a smooth and guided experience. Along with test preparation for IELTS, GRE, TOEFL, and SAT, we provide expert services such as SOP writing, visa guidance, accommodation support, scholarship assistance, and education loan support. Our expertise and commitment to excellence make us a reliable partner for students pursuing international education.
Start Your PTE Prep with Free Demo!
Score high in PTE with top trainers' guidance!








Global Headquarters
Kanan Int EdTech Inc
320 Bay Street, Suite 321 (Spaces), Toronto ON, Canada M5B 1N9
Indian Headquarters
Kanan International Pvt. Ltd.
D-wing, 2nd Floor, Trident Complex, Ellora Park Vadiwadi Road, Vadodara, Gujarat 390007
IT/ Digital Campus
Kanan International Pvt. Ltd
Old, New No 3, 2nd Floor, 1A, Dr Sadasivam Rd, T. Nagar, Chennai, Tamil Nadu 600017
Our branches
- Bardoli
- Bharuch
- Chennai
- Dehradun
- Gurugram
- Himatnagar
- Karnal
- Nadiad
- Navsari
- Palanpur
- Rajkot
- Vadodara
- Valsad
- Vallabh Vidyanagar
- Vapi
Study Abroad
Test Prep
Top Universities
Consultants
IELTS Centers
GRE Centers
TOEFL Centers
SAT Centers
Language Courses in Vadodara
SOP Blogs
Featured Blogs
Study Abroad Consultants in Chennai
Study Abroad Consultants in Surat
Study Abroad Consultants in Navsari
Study Abroad Consultants in Bardoli
Study Abroad Consultants in Ahmedabad
Study Abroad Consultants in Anand
Study Abroad Consultants in Khanna
Study Abroad Consultants in Nadiad
Study Abroad Consultants in Vadodara
Study abroad consultants in Valsad
Copyright © 2026 KANAN.CO All rights reserved.