- Study Abroad
- / pte
- / speaking describe image practice tips template
PTE Describe Image - Practice Exercises, Template, Tips and Tricks


Author
24-06-2024

The speaking section is one of the modules of the PTE academic test which has 6 different question types. Describe image is one of the question types in the PTE speaking section. In this task, you have to verbally describe the images appearing on the screen within 40 seconds. You will be given 25 seconds to study the image and prepare. Once you hear a short tone, you can start speaking until the microphone opens. The PTE describe image question is scored based on 3 criteria: content, pronunciation, and oral fluency, where each is evaluated based on a scale of 0-5. In this article, you’ll find samples, templates of each describe image question type, and tips to score high.
The types of PTE describe image questions are:
- Bar Graph
- Line Graph
- Map
- Pie Chart
- Process chart/Flow chart
- Table
- Venn Diagram
- Photo
Bar Graph
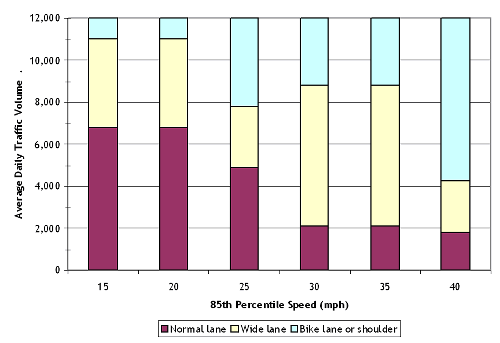
Bar graph PTE describe image template
- Introduction: The given bar graph illustrates the [topic] measures based on [traffic] and [speed]. It presents a clear overview of the [variable] measured on the vertical axis and the corresponding [categories] on the horizontal axis. This graphical representation aims to elucidate the measurement in [variable] based on [categories].
- Body: As observed from the graph, it is evident that [category A] has the highest/lowest [variable] compared to [categories B and C]. The data reveals a notable increase/decrease in [variable] from [X to Y], indicating a significant trend in [category Z].
- Conclusion: To conclude, the bar graph provides a comprehensive view of the variations in [variable] across different [categories]. The data highlights [key trend] and emphasizes the impact of [specific factor] on the overall pattern. These insights contribute to a better understanding of the dynamics involved in [topic].
Check PTE Describe Image Practice 1 - Bar Graph
Line Graph

Line graph PTE describe image template
- Introduction: The presented line graph depicts the trends in [variable] over a specified period of time. The x-axis represents [time units], while the y-axis displays the corresponding values of [variable]. This visual representation is designed to offer insights into the fluctuations and patterns observed in [variable] during the given timeframe.
- Body: As I examine the line graph closely, several key trends emerge. There is a noticeable [increase/decrease] in [variable] from [time point A to B], indicating a significant shift in [aspect]. Additionally, during [specific time period], there is a distinct [peak/trough] in the line, suggesting [possible explanation]. Moreover, the [variable] experiences [gradual/rapid] changes, highlighting the dynamic nature of [trend].
- Conclusion: In conclusion, the line graph effectively communicates the variations in [variable] over time. The observed trends and fluctuations provide valuable information about the dynamics of [topic]. This understanding can be helpful in making informed decisions or predictions related to [context].
Check PTE Describe Image Practice 2 - Line Graph
Map
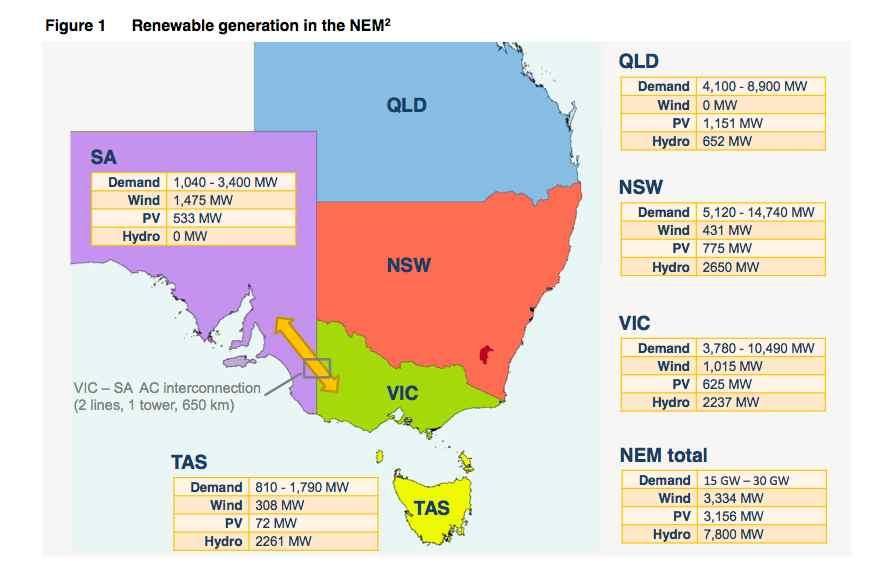
Map PTE describe image template
- Introduction: The provided map offers a geographical overview of [location or region]. It shows the key features such as [landmarks, cities, or regions]. The purpose of this map is to help us understand the distribution and relationships among various elements in [location or region].
- Body: In the map, several noteworthy details become apparent. [Landmark or city A] is prominently situated in the [direction] of the map, and it serves as a focal point for [describe its significance]. Furthermore, the presence of [geographical feature or city B] in the [direction] indicates [possible relationship or significance]. The map also illustrates the connectivity through [describe transportation routes or infrastructure] and highlights concentrations of [specific features] in certain areas.
- Conclusion: To conclude, the map provides a valuable visualization of the geographical layout of [location or region]. The key features presented in the map contribute to a better understanding of the overall geography and relationships within [location or region]. Overall, the map serves as a useful tool for comprehending the geographical dynamics of [location or region].
Check PTE Describe Image Practice 3 - Map
Pie chart
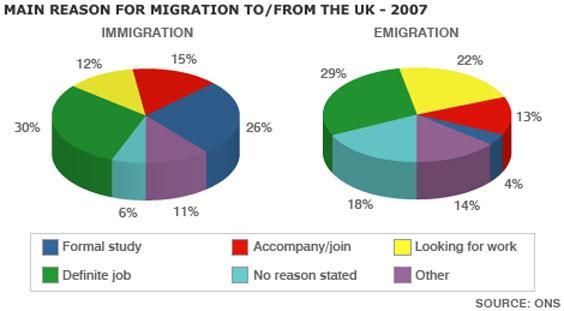
Pie chart PTE describe image template
- Introduction: The given pie chart illustrates the distribution of [category or variable] among different segments. Each segment represents a distinct portion of the whole, and the chart aims to provide a clear visual representation of how [category or variable] is divided. Understanding the proportions within each segment is key to comprehending the overall distribution depicted in the pie chart.
- Body: From the pie chart, it becomes apparent that [specific segment] constitutes the largest/smallest portion, representing [percentage]% of the entire pie. Notably, [another segment] follows closely behind, making up [percentage]% of the distribution. The remaining segments, including [list additional segments], contribute to the overall composition. This distribution pattern reflects [possible interpretation, trend, or emphasis] in relation to [category or variable].
- Conclusion: In summary, the pie chart effectively communicates the proportional breakdown of [category or variable].
Check PTE Describe Image Practice 4 - Pie Chart
Process chart/Flow chart
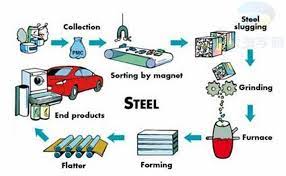
Process chart/Flow chart PTE describe image template
- Introduction: The presented process chart outlines the sequential stages involved in [describe the process]. Each step is visually represented, and the chart aims to illustrate the progression from the initial phase to the final outcome.
Body: Analyzing the process chart clearly shows the various steps that [describe the process]. The first stage involves [explain the initial step], followed by [subsequent steps] leading up to the final step, which is [describe the final outcome or result]. Each arrow or connection between the steps signifies the flow or transition from one stage to the next. - Conclusion: In conclusion, the process chart provides a comprehensive visual representation of the sequential steps involved in [describe the process].
Check PTE Describe Image Practice 5 - Process Chart
Table
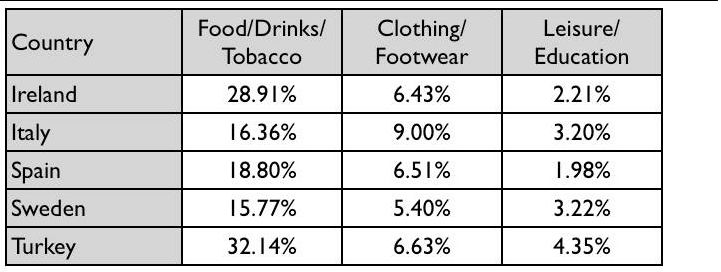
Table PTE describe image template
- Introduction: The given table illustrates [topic] over a [data]. The [title] provides insights into [main subject] with data presented along [relevant axes].
- Body: Looking at the data, it's evident that [specific observation]. For instance, [highlight a significant data point or trend]. Additionally, there is a noticeable [pattern or change]. It's interesting to observe [specific element] correlates with [another element]. The data suggests [any implications or insights].
- Conclusion: To sum up, the data in the table/chart reveals [main findings]. The trends indicate [key insights], and the relationships between [relevant elements] are noteworthy. In conclusion, [reiterate the importance of the findings].
Venn Diagram
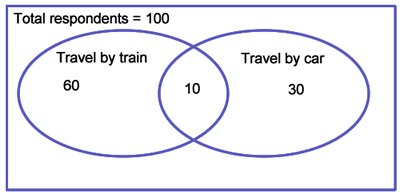
Venn Diagram PTE describe image template
- Introduction: The provided Venn diagram illustrates the relationships and intersections between distinct sets of [categories or variables]. Each circle represents a specific set, and the overlapping areas demonstrate the shared characteristics between these sets.
- Body: In the Venn diagram it is clear that [describe the characteristics or elements] are represented in [circle A], while [describe other characteristics or elements] are represented in [circle B]. The overlapping region between [circle A and B] indicates the common elements between the two sets.
- Conclusion: To summarize, the Venn diagram conveys the relationships and intersections between [categories or variables]. The shared elements provide valuable insights into the similarities and differences among the represented sets.
Tips and Tricks of Describe Image in PTE
The following are the tips to answer the describe image task in PTE.
1. Understand the Task:
During the 40-second preparation time, it is crucial to examine the given image, whether it's a graph, chart, map, or diagram. Pay close attention to key components such as labels, axes, trends, patterns, and any notable features. Take quick but comprehensive notes that will serve as a roadmap for structuring your response.
2. Organize Your Response:
Crafting a well-organized response is key to scoring well on the Pearson test. Begin with a introduction that provides an overview of the image and its subject matter. Proceed to the main body, where you describe key points, trends, and comparisons in a logical sequence. The use of appropriate transition words and phrases will ensure a seamless flow of information. And end with a concise conclusion.
3. Use Descriptive Language:
To make your description engaging and informative, use a range of descriptive language. Utilize adjectives, adverbs, and precise vocabulary to portray the characteristics, quantities, and relationships depicted in the image.
4. Highlight the Main Points:
While describing the image in PTE exam, focus on the highest and lowest data, changing trends, and any other significant aspects. Structure your sentences accordingly, ensuring that the main points are highlighted prominently in your response.
5. Practice Time Management:
Effective time management is crucial in the Describe Image task. Deliver a well-structured and comprehensive response within the allocated 40 seconds. Regular practice, both in preparation timing and actual speaking, will help you hone this skill.
6. Develop Fluency and Pronunciation:
Work on developing fluency and maintaining a steady pace throughout your response. Clear pronunciation, appropriate stress, and intonation are important for effective communication. Regular practice in speaking English contributes significantly to overall fluency.
7. Use Transitional Phrases:
Incorporate transitional phrases into your response to connect ideas and facilitate a flow of information. Phrases such as "Firstly," "Moreover," "On the other hand," and "In conclusion" help structure your response coherently, enhancing its overall clarity.
8. Practice Describing Various Image Types:
Expose yourself to different types of images, including graphs, charts, maps, and diagrams. Practice describing these images within the given time limit, familiarizing yourself with the specific language and vocabulary associated with each image type.
9. Seek Feedback:
Record yourself while practicing the Describe Image task and actively seek feedback from teachers, peers, or online communities. Analyzing your performance, identifying areas for improvement, and incorporating constructive feedback are essential for refining your skills.
10. Speak continuously:
Emphasize the importance of continuous speech during the task. Regardless of whether you fully understand the image, speak as much as possible within the time limit. Avoid fillers and use range of vocabulary.
11. Don't Speak for 40 Seconds:
It's advisable to conclude your response by 35-36 seconds, preventing potential mistakes or omissions that may arise from attempting to speak for the full duration. This ensures a more focused and error-free delivery.
12. Speak For More Than 30 Seconds:
To achieve higher scores, aim to speak for more than 30 seconds, with pronunciation and fluency taking precedence over the content. Relevance to the image or graph remains crucial, and a well-articulated response contributes to a stronger overall performance.
Conclusion
In conclusion, the PTE Describe Image task checks how well you can understand the picture pictures like graphs, charts, maps, and photos and convey it fluently. It is important to notice the key details, putting your thoughts in order, and speaking clearly. Practice well with the given describe image examples and templates, and work on improving your English to score well in this part of the PTE academic speaking test.

About Author Arivarasi
Arivarasi is an experienced author with expertise in the study abroad industry and preparing test materials for exams like IELTS, TOEFL, GRE, SAT, PTE, etc. She stays up-to-date with university and college requirements for international students which allows her to provide guidance on course selection, documents like SOP, LOR, and scholarship opportunities. She has written numerous articles on study abroad exams, destinations, universities & colleges requirements, admission procedures, and the entire process of studying abroad. Collaborating with industry experts and counselors, she crafts informative articles that make students take the right decisions.
Kanan.co is a trusted study abroad consultancy offering comprehensive services, resources, and solutions for students and education institutions. We support students at every stage of their global education journey, ensuring a smooth and guided experience. Along with test preparation for IELTS, GRE, TOEFL, and SAT, we provide expert services such as SOP writing, visa guidance, accommodation support, scholarship assistance, and education loan support. Our expertise and commitment to excellence make us a reliable partner for students pursuing international education.
Start Your PTE Prep with Free Demo!
Score high in PTE with top trainers' guidance!








Global Headquarters
Kanan Int EdTech Inc
320 Bay Street, Suite 321 (Spaces), Toronto ON, Canada M5B 1N9
Indian Headquarters
Kanan International Pvt. Ltd.
D-wing, 2nd Floor, Trident Complex, Ellora Park Vadiwadi Road, Vadodara, Gujarat 390007
IT/ Digital Campus
Kanan International Pvt. Ltd
Old, New No 3, 2nd Floor, 1A, Dr Sadasivam Rd, T. Nagar, Chennai, Tamil Nadu 600017
Our branches
- Bardoli
- Bharuch
- Chennai
- Dehradun
- Gurugram
- Himatnagar
- Karnal
- Nadiad
- Navsari
- Palanpur
- Rajkot
- Vadodara
- Valsad
- Vallabh Vidyanagar
- Vapi
Study Abroad
Test Prep
Top Universities
Consultants
IELTS Centers
GRE Centers
TOEFL Centers
SAT Centers
Language Courses in Vadodara
SOP Blogs
Featured Blogs
Study Abroad Consultants in Chennai
Study Abroad Consultants in Surat
Study Abroad Consultants in Navsari
Study Abroad Consultants in Bardoli
Study Abroad Consultants in Ahmedabad
Study Abroad Consultants in Anand
Study Abroad Consultants in Khanna
Study Abroad Consultants in Nadiad
Study Abroad Consultants in Vadodara
Study abroad consultants in Valsad
Copyright © 2026 KANAN.CO All rights reserved.