- Study Abroad
- / pte
- / process chart
How to Describe Process Chart PTE?


Author
01-03-2024


The PTE Describe Image task in speaking section holds significant importance, comprising approximately 6-7 questions. There are 8 common types of images that typically appear in the PTE Academic Speaking Test. One such type of image is a Process chart
The process chart PTE can be described in three steps.
- Introduction - Give a brief overview of the image and paraphrase the diagram's title in your introduction.
- Body - The primary part of your description should be stated next. Choose the three most important elements in that picture for this section.
- Conclusion - In the end, provide a brief conclusion.
During the PTE Academic test, you may encounter questions where one or more images are presented. You will have 25 seconds to prepare and 40 seconds to describe each task. Although this task can be quite daunting, this article aims to help you analyze the given process chart pte practice examples, and answer effectively within the limited time frame.
PTE Describe Image Process Chart Practice samples
To help you know how to answer the PTE process chart question, a few process charts are shown below with the model answers.
Process chart sample 1
Question: Describe the process given below in 40 seconds.

Answer: The picture depicts how a new home is designed. The procedure starts when the client fills out a questionnaire and is completed when a cosy, well-lit home is built. The design phase starts after an initial consultation that is free. In this phase the concept is designed and it is developed. Pre-construction comes next where the quotation price is fixed, the contract is signed and the building is approved for the next phase named construction. In this phase, the building has completed its construction within the predicted construction period. Maintenance check is done and the keys are handed over to the respected owner in the last stage. The customers can then relax in their brand-new house.
Process chart sample 2
Question: Describe the process given below in 40 seconds.
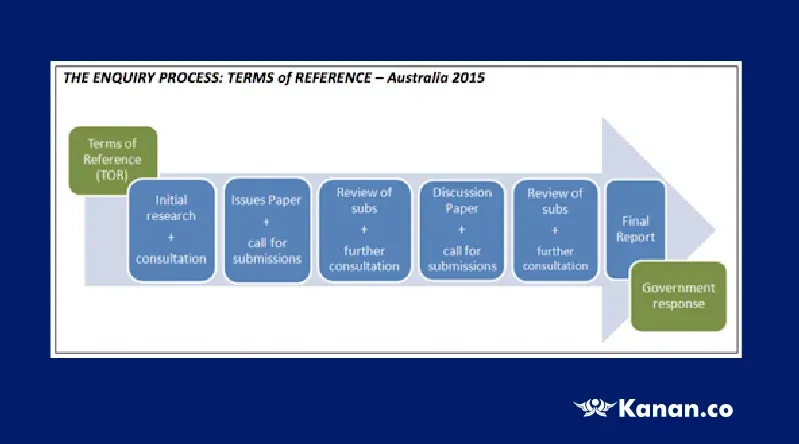
Answer: The image shows the Enquiry Process and Terms of Reference for Australia in 2015. This process commences with the Terms of Reference and concludes with the Government's response. Initially, it involves preliminary research and consultations, followed by the creation of an Issues Paper and a call for submissions. Subsequently, there is an examination of the received submissions, leading to the development of a Discussion Paper. After review and additional consultations, a final report is generated. This report is then submitted to the government, which may result in a response involving potential legislative changes.
Process chart sample 3
Question: Describe the process given below in 40 seconds
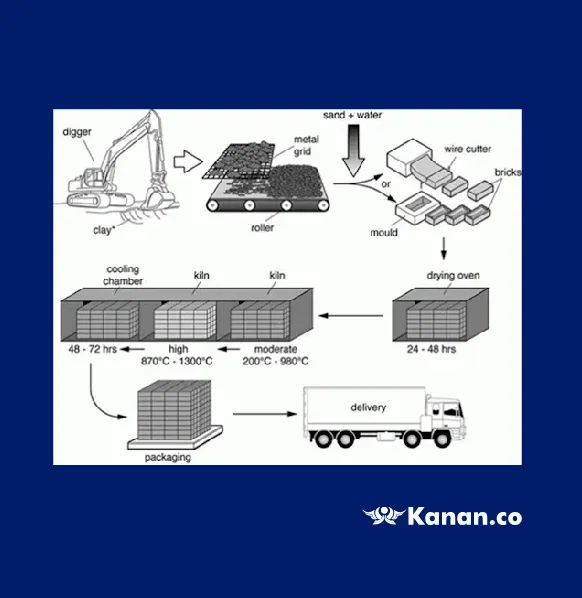
Answer: The diagram illustrates the brick manufacturing process for the construction industry. It begins with a digger digging and transporting clay to a metal grid, where the clay is broken into smaller fragments and then conveyed to a roller. Subsequently, water and sand are added into the clay, forming a mixture that is directed either into a wire cutter or a mould for brick shaping. Afterward, the bricks are placed in an oven for drying.
The bricks undergo a heating process in a kiln, initially at a moderate temperature and then at a higher temperature, ranging from 200°C to 1300°C. This is followed by a cooling phase in a chamber lasting 2-3 days. Finally, the bricks are packaged and prepared for delivery to consumers.
Process chart sample 4
Question: Describe the process given below in 40 seconds.
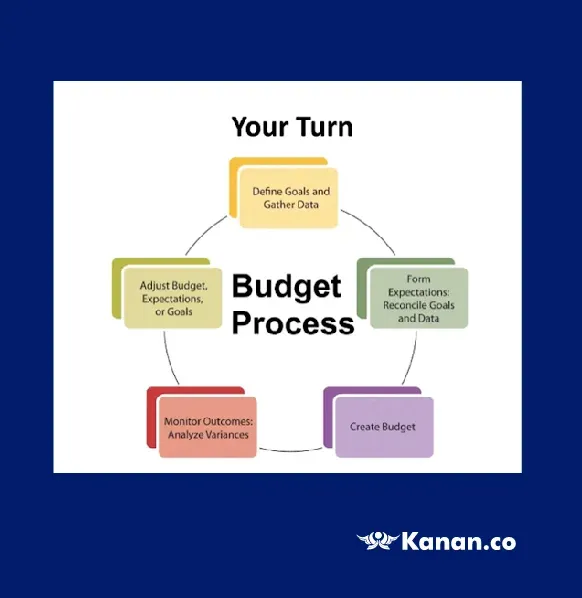
Answer: The flowchart depicts the several processes in the budgeting process. Goal-setting and data collection are the first steps in the process. Setting expectations is the next step, and then the real budget is made. Following the creation of the budget, the results are evaluated, and the conclusion is utilised to modify the budget, the expectations, and the goal, which ultimately feeds into the following cycle. To sum it up, the diagram effectively conveys the budgeting process.
Process chart sample 5
Question: Describe the process given below in 40 seconds.
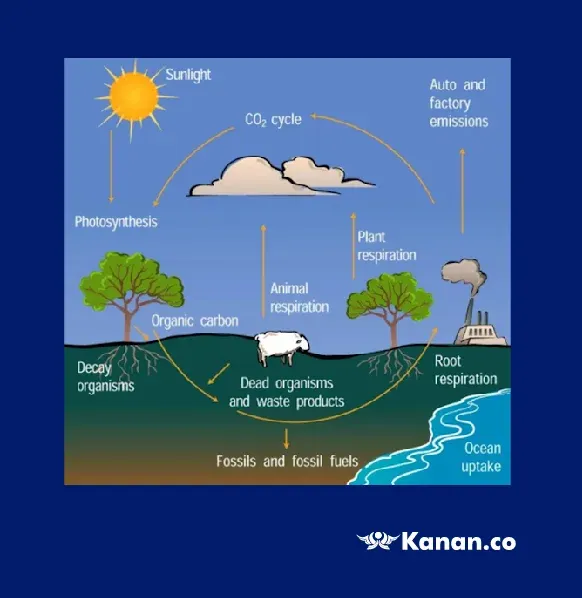
Answer: The diagram gives a clear explanation of the fundamental processes and how carbon goes through many stages to form a complete cycle. In the first place, it is observed that plants convert solar energy into organic carbon through a process known as photosynthesis. Underground, some carbon is trapped as fossils and fossil fuels. Carbon is released into the atmosphere in a variety of ways. The first occurs when people burn fossil fuels in automobiles and factories, and the second happens when plants and animals breathe. This carbon is released into the atmosphere as CO2, where it is subsequently reabsorbed by plants, restarting the cycle. Overall, it is clear that carbon is transported naturally, while the equilibrium may currently be affected by human activity.
Process chart sample 6
Question: Describe the process given below in 40 seconds.
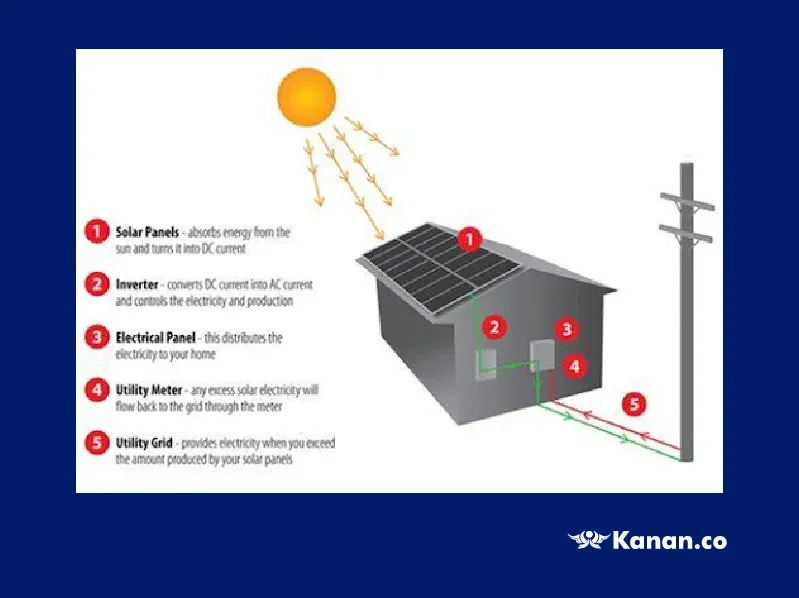
Answer: The diagram outlines the procedure for generating household electricity using solar panels. When solar panels are installed on a house's roof, they capture solar energy and convert it into DC current. An inverter plays a crucial role in transforming this DC current into AC current, managing electricity production, and distributing it throughout the entire home. Lastly, in cases where the electricity generated by your solar panels falls short, the utility grid steps in to supply the additional power needed.
Process chart sample 7
Question: Describe the process given below in 40 seconds.
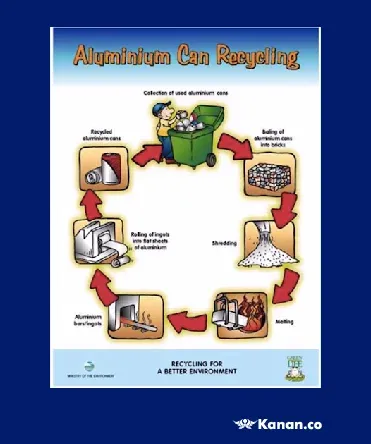
Answer: The image depicts the recycling journey of aluminium cans. Initially, used aluminium cans are gathered and transported to recycling centers, where they undergo a process involving boiling to transform them into aluminium bricks. Next, the cans are shredded and melted down to create aluminium bars. Subsequently, these bars are rolled into flat sheets. In the final phase, these sheets are moulded into cans, rendering them ready for reuse. In summary, this process exhibits remarkable efficiency and serves as an effective means to prevent the pollution caused by discarded aluminium cans.
Process chart sample 8
Question: This is an example of a natural process diagram in another typical PTE Speaking exam question type. This technique, which is broken down into nine steps, will test your ability to cover all of the diagrams in 40 seconds. During this procedure, you will have 25 seconds to examine the diagram.
Tip: You should understand what the actual diagram represents so that you can speak more clearly. There are nine parts, and in order to get better marks, you must speak for each one of them.

Answer: This is a natural process observed in volcanic islands. Initially, during the Preshield and Protoshield stages, a mountain gradually develops beneath the sea's surface. In the third, or explosive phase, hydro-explosions occur, resulting in the deposition of ash cones. Over time, numerous cinder cones accumulate to create a shield top of the volcano.
Eventually, this shield erodes and subsides, forming underwater reefs. Despite this, volcanic activity, such as lava flows, persists. As the process continues into the Coral Atoll stage, the volcano eventually vanishes, and the entire formation sinks beneath the sea during the Guyot stage.
In conclusion, a substantial volcano undergoes a rise and fall beneath the sea in a natural progression known as the volcanic island growth cycle.
Process chart sample 9
Question: Describe the process given below in 40 seconds.
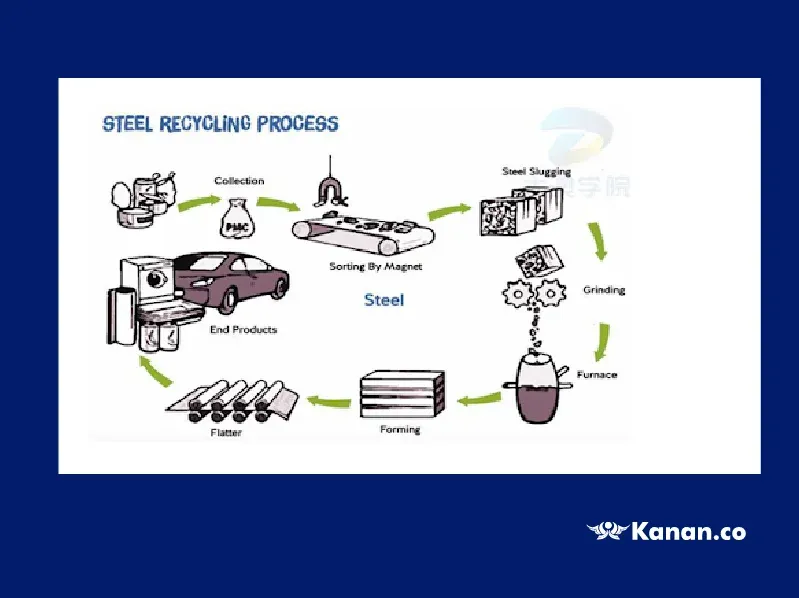
Answer: To begin with, there are a total of nine steps in this process, involving collection, magnetic sorting, steel slugging, grinding, furnace treatment, forming, flattening, and ultimately, the creation of the end product.
As the chart's represents, the process begins with waste collection. Subsequently, the waste undergoes magnetic sorting to separate the steel content. Following this, steel slugging occurs, followed by the grinding of materials. Next, the processed material is subjected to furnace treatment. This is followed by the forming stage and subsequently, flattening. Finally, the end product emerges, which can take various forms, such as a car or a washing machine, among others.
Process chart sample 10
Question: Describe the process given below in 40 seconds.
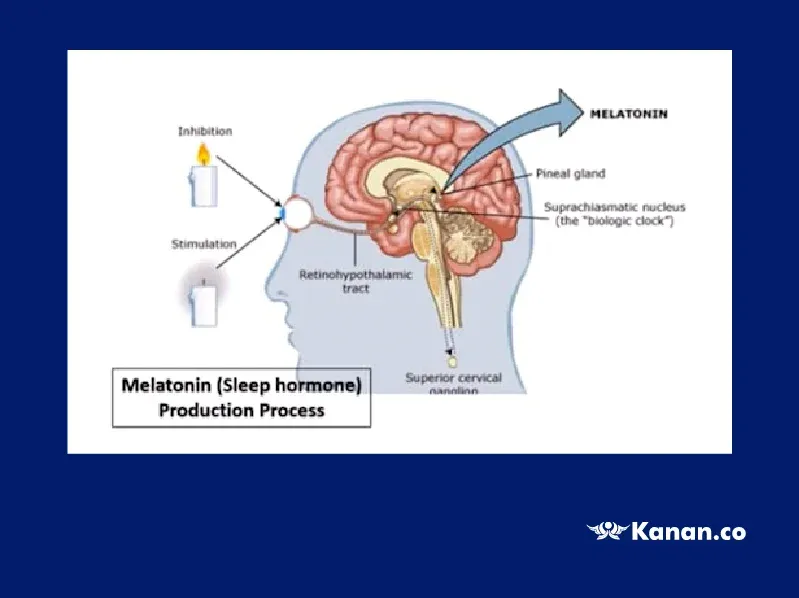
Answer: This image illustrates the production of the sleep hormone known as Melatonin. When the human eye sees candlelight, it triggers an inhibitory response, while darkness stimulates Melatonin production. The pineal gland in the brain produces melatonin in response to signals from the eyes. This interplay between production and inhibition forms the body's biological clock.
In summary, this process demonstrates how our body reacts to light and darkness, and how Melatonin production is closely connected to light exposure.
Conclusion
To conclude, in addition to practice samples and answers of process chart pte it is advised to acquire training from knowledgeable instructors if you want to succeed and earn a good score on your PTE exam. Don't miss the opportunity to sign up for the Kanan PTE Academic Course. As part of the training, we also offer helpful practice materials in addition to having qualified educators who are knowledgeable in the subject.
FAQS
1. Whether the candidate get high marks by writing a conclusion?
It's not mandatory, and candidates don't receive high scores by writing the conclusion. However, the overview is crucial for achieving a good grade.
2. How do you describe an image in PTE test?
Provide a general description of the image or picture while describing them. Mention what the image is about, and the message it is trying to express, and give one or two sentences about the image.
3. How many questions in PTE describe image?
On the day of the exam, you should expect to see 6-7 of these kinds of questions. You will have 40 seconds to provide as many details about the provided image as possible.
4. How marks are segregated for PTE Describe image?
Marks are contributed solely to your speaking score which includes the content, pronunciation, and oral fluency. PTE Describe image section is 15 marks which are split into: 5 for content; 5 for pronunciation; and 5 for oral fluency.

About Author Swathi Krishnan
Swathi Krishnan, an MBA graduate with an unwavering passion for writing and reading, is a distinguished expert in Study Abroad Services. With extensive experience in the overseas education industry, Swathi has become a trusted authority in the field, specializing in the preparation of test materials for exams such as IELTS, TOEFL, GRE, SAT, PTE, and more. Her comprehensive knowledge is evident through her numerous articles, covering a spectrum of topics, from drafting Statements of Purpose (SOPs) and Letters of Recommendation (LORs) to decoding study abroad exams, destinations, university requirements, admission procedures, and the entire process of obtaining an international education. Swathi's dedication to helping study abroad aspirants make informed decisions is reflected in her informative articles, making her a valuable resource for those embarking on their educational journeys.
Kanan.co is a trusted study abroad consultancy offering comprehensive services, resources, and solutions for students and education institutions. We support students at every stage of their global education journey, ensuring a smooth and guided experience. Along with test preparation for IELTS, GRE, TOEFL, and SAT, we provide expert services such as SOP writing, visa guidance, accommodation support, scholarship assistance, and education loan support. Our expertise and commitment to excellence make us a reliable partner for students pursuing international education.
Start Your PTE Prep with Free Demo!
Score high in PTE with top trainers' guidance!








Global Headquarters
Kanan Int EdTech Inc
320 Bay Street, Suite 321 (Spaces), Toronto ON, Canada M5B 1N9
Indian Headquarters
Kanan International Pvt. Ltd.
D-wing, 2nd Floor, Trident Complex, Ellora Park Vadiwadi Road, Vadodara, Gujarat 390007
IT/ Digital Campus
Kanan International Pvt. Ltd
Old, New No 3, 2nd Floor, 1A, Dr Sadasivam Rd, T. Nagar, Chennai, Tamil Nadu 600017
Our branches
- Bardoli
- Bharuch
- Chennai
- Dehradun
- Gurugram
- Himatnagar
- Karnal
- Nadiad
- Navsari
- Palanpur
- Rajkot
- Vadodara
- Valsad
- Vallabh Vidyanagar
- Vapi
Study Abroad
Test Prep
Top Universities
Consultants
IELTS Centers
GRE Centers
TOEFL Centers
SAT Centers
Language Courses in Vadodara
SOP Blogs
Featured Blogs
Study Abroad Consultants in Chennai
Study Abroad Consultants in Surat
Study Abroad Consultants in Navsari
Study Abroad Consultants in Bardoli
Study Abroad Consultants in Ahmedabad
Study Abroad Consultants in Anand
Study Abroad Consultants in Khanna
Study Abroad Consultants in Nadiad
Study Abroad Consultants in Vadodara
Study abroad consultants in Valsad
Copyright © 2026 KANAN.CO All rights reserved.