- Study Abroad
- / pte
- / pie chart
How to Describe Pie Chart PTE?


Author
31-12-2025


The Pearson Test of English (PTE) is a widely recognized English language assessment designed to evaluate the language skills of non-native English speakers. The PTE exam spans three hours and encompasses three modules: Speaking and writing, Listening, and Reading. The Speaking & Writing module, which is the lengthiest, spans 77-93 minutes and evaluates candidates' writing and speaking abilities. PTE Describe Image is one of the questions among 8 questions asked in the Speaking & Writing module.
In the "Describe Image" task, you are presented with an image, in the form of a pie chart, and are given 25 seconds to analyze it. Subsequently, you must give a detailed description of the chart in your own words within a 40-second timeframe.
Following are the steps to describe the Pie Chart PTE
1. Introduction: Start by introducing the pie chart and rephrasing the question's information.
2. Outline: Next, outline the key features of the pie chart.
3. Specific Details: Finally, delve into group-specific details, in 2 to 3 paragraphs, addressing the questions posed.
In this article, you’ll be able to improve the ability to analyze pie chart PTE quickly with the provided practical samples and tips.
Pie Chart PTE Practice samples
To help the applicants identify details from the pie graph PTE, we’ve given the pie charts with the associated questions.
Pie chart sample 1
Question: Summarise the data in the pie chart in 40 seconds by choosing and stating the key elements.

Answer: The pie chart represents the Homelessness of US people by race and ethnicity. It is illustrated that 40.6% of White Non-Hispanic were homeless taking up the largest portion, closely followed by Black non-Hispanic with 39.6%.
Hispanics and Native Americans had percentages that are closer to each other of 10.9% and 7.9%, respectively. The remaining 1% is left for other, non-specified ethnicities.
Pie chart sample 2
Question: What is the preferred mode of commuting? Summarise the data in the pie chart in 40 seconds by choosing and stating the key elements.
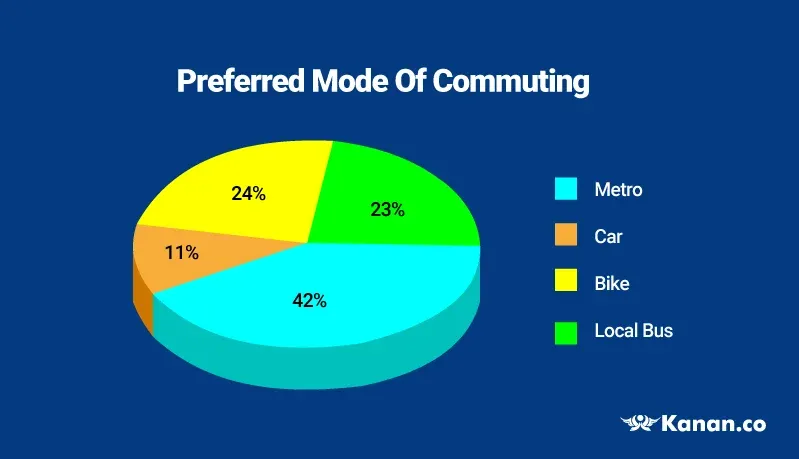
Answer: The pie chart shows the result of the survey in which people were asked about their preferred mode of commuting. It is illustrated that 42% of people prefer the Metro which is the most preferred mode of commuting.
Bike and Local Bus have similar percentages of 24% and 23% respectively. Only 11% of people prefer a car, which is the least preferred mode of commuting.
Pie chart sample 3
Question: Summarise the data in the pie chart in 40 seconds by choosing and stating the key elements.
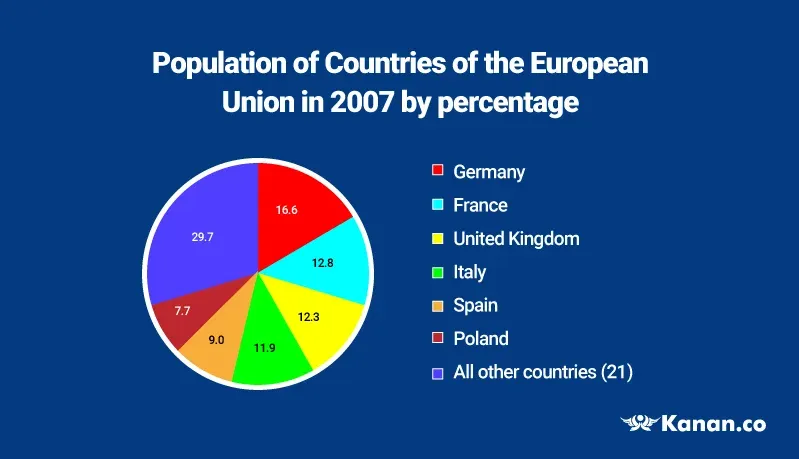
Answer: This pie chart illustrates the population distribution among European Union countries in 2007, presented as percentages. Germany holds the highest position with 16.6% of the population, closely followed by France at 12.8%. The United Kingdom and Italy rank 3rd and 4th, each with a population just below 13%. Spain and Poland have the lowest populations among the European Union countries.
In summary, Germany boasted the highest population, while Poland had the smallest. Additionally, the chart does not specify the populations of 21 other countries, which collectively account for approximately 30% of the total population.
Pie chart sample 4
Question: Summarise the data in the pie chart in 40 seconds by choosing and stating the key elements.
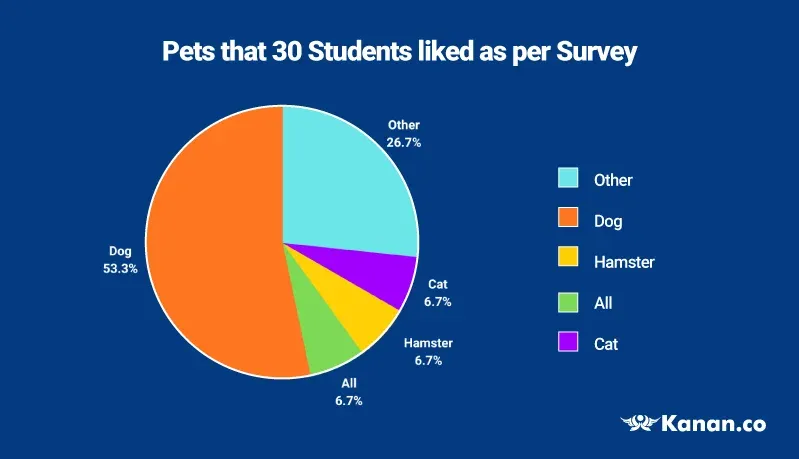
Answer: This pie chart depicts the outcome of a survey conducted by an individual among 30 children to determine their favourite pets. The data reveals that the highest preference, at 53.33%, is for dogs. Cats are favoured by 6.67% of the students, while the same percentage, 6.67%, express a liking for hamsters as pets. An additional 6.67% of the students prefer pets other than dogs, cats, and hamsters, and 26.67% of the students indicate that they like all types of pets.
Pie chart sample 5
Question: Summarise the data in the pie chart in 40 seconds by choosing and stating the key elements.
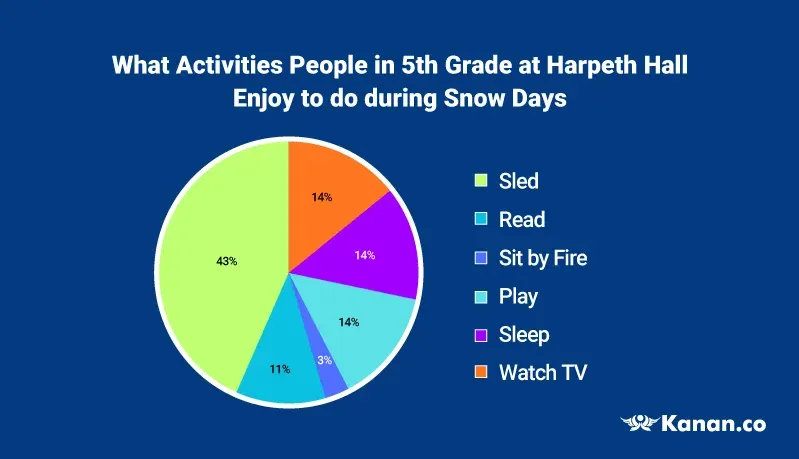
Answer: The pie chart breaks down the activities that 5th-grade students at Harpeth Hall engage in during snow days. It reveals that 43% of the students opt for sledding in the snow, while 14% prefer watching TV. Another 14% enjoy outdoor play, and an additional 14% choose to relax and sleep. Reading books is the choice for 11% of the students, while a mere 3% opt to sit by the fire during snow days.
Pie chart sample 6
Question: Summarise the data in the pie chart in 40 seconds by choosing and stating the key elements

Answer: The information on post-secondary degrees granted in 1996–1997 is displayed in the pie chart. The percentage of degrees awarded for first-year professional and doctoral degrees has remained below 5%, while the highest percentage of degrees awarded for the profession of Bachelor's was 47%, followed by the percentage of degrees for Associate's, which was 27% closely followed by percentage of degrees for Master’s which was 20%. The majority of students were bachelor's degree holders, while the proportion of doctors was minimal.
Tips to describe pie chart PTE effectively
Effectively responding to pie chart questions can significantly boost your overall band score on the PTE exam. The following tips can help candidates answer pie chart questions in a clear and organized manner.
- Follow right structure - Begin by carefully reading the question to identify essential information. Pie chart questions in PTE typically adhere to a specific format: introduction, outline, and specific details. Candidates should adhere to this structure to ensure their responses are well-organized and cohesive.
- Use correct tense - Ensure that the tense used in your response matches the time frame depicted in the pie chart.
- Be proficient in grammar - Practice grammar and vocabulary for effective paraphrasing. A strong vocabulary can significantly contribute to a high PTE score, given that vocabulary accounts for about 25% of the overall exam score.
- Use different words - To prevent using the same words repeatedly, try using different expressions, but remember to keep an eye on the word count.
- Include all relevant information - Your image description should be logically structured and contain specific information, including potential developments, implications, or conclusions. Failure to cover all relevant information in an organized manner may result in a lower score.
- Fluency in speech - Focus on responding with appropriate phrasing, a consistent rhythm, and proper stress. Steady and natural speech delivery is crucial. Hence, avoid hesitation, repetition, or false starts, as they can negatively impact your score.
- Easy to understand - Ensure that your response is articulated in a way that a regular speaker can readily understand.
Also Practice
- Bar Graph PTE
- Line Graph PTE
- Process Chart PTE
- Map Chart PTE
Conclusion
The PTE pie charts sample with answers presented in the article serve as examples to illustrate how to respond effectively in the "Describe Image" section. Additionally, provided tips and guidelines for pie chart pte can help improve your score in this section.
FAQS
1. How many words are to be used to describe pie charts in PTE?
The applicant must write a minimum of 150 words or more. The ideal word count ranges from 160 to 180.
2. What are the basic components of the pie chart answers?
Introduction, key highlights, and conclusion are the basic components of pie charts.
3. Whether the candidate can conclude by giving an opinion on pie chart data?
No, the candidate is not required to give any opinion on the pie chart. Instead of working on other evaluations, the candidate must prepare statistics and provide a summary.
4. Which tense should be used while describing the pie chart?
The candidate must use the proper tense in accordance with the time period depicted in the pie chart. Look for dates in the pie chart and graph titles and subtitles. Use the past tense if the year is 2025 or before; the future tense if the year is after the present year (i.e.2026) and the present simple tense if there is no year.

About Author Swathi Krishnan
Swathi Krishnan, an MBA graduate with an unwavering passion for writing and reading, is a distinguished expert in Study Abroad Services. With extensive experience in the overseas education industry, Swathi has become a trusted authority in the field, specializing in the preparation of test materials for exams such as IELTS, TOEFL, GRE, SAT, PTE, and more. Her comprehensive knowledge is evident through her numerous articles, covering a spectrum of topics, from drafting Statements of Purpose (SOPs) and Letters of Recommendation (LORs) to decoding study abroad exams, destinations, university requirements, admission procedures, and the entire process of obtaining an international education. Swathi's dedication to helping study abroad aspirants make informed decisions is reflected in her informative articles, making her a valuable resource for those embarking on their educational journeys.
Kanan.co is a trusted study abroad consultancy offering comprehensive services, resources, and solutions for students and education institutions. We support students at every stage of their global education journey, ensuring a smooth and guided experience. Along with test preparation for IELTS, GRE, TOEFL, and SAT, we provide expert services such as SOP writing, visa guidance, accommodation support, scholarship assistance, and education loan support. Our expertise and commitment to excellence make us a reliable partner for students pursuing international education.
Start Your PTE Prep with Free Demo!
Score high in PTE with top trainers' guidance!








Global Headquarters
Kanan Int EdTech Inc
320 Bay Street, Suite 321 (Spaces), Toronto ON, Canada M5B 1N9
Indian Headquarters
Kanan International Pvt. Ltd.
D-wing, 2nd Floor, Trident Complex, Ellora Park Vadiwadi Road, Vadodara, Gujarat 390007
IT/ Digital Campus
Kanan International Pvt. Ltd
Old, New No 3, 2nd Floor, 1A, Dr Sadasivam Rd, T. Nagar, Chennai, Tamil Nadu 600017
Our branches
- Bardoli
- Bharuch
- Chennai
- Dehradun
- Gurugram
- Himatnagar
- Karnal
- Nadiad
- Navsari
- Palanpur
- Rajkot
- Vadodara
- Valsad
- Vallabh Vidyanagar
- Vapi
Study Abroad
Test Prep
Top Universities
Consultants
IELTS Centers
GRE Centers
TOEFL Centers
SAT Centers
Language Courses in Vadodara
SOP Blogs
Featured Blogs
Study Abroad Consultants in Chennai
Study Abroad Consultants in Surat
Study Abroad Consultants in Navsari
Study Abroad Consultants in Bardoli
Study Abroad Consultants in Ahmedabad
Study Abroad Consultants in Anand
Study Abroad Consultants in Khanna
Study Abroad Consultants in Nadiad
Study Abroad Consultants in Vadodara
Study abroad consultants in Valsad
Copyright © 2026 KANAN.CO All rights reserved.