- Study Abroad
- / ielts
- / writing
- / task
- / pie chart
- / how to write
How To Write Pie Chart Essay?


Author
23-06-2025


Pie chart is one of the essential essay types in the IELTS academic writing task 1. In this post, you will learn how to write pie chart and the six steps involved in it. You need to write an introduction, overview, 1st feature and 2nd feature to properly structure a IELTS writing task 1 pie chart essay.
Check Out our YouTube Channel to Practice Full-Length IELTS Listening Tests Daily

The steps involved in describing the pie chart essay are as follows
- Step 1: Analyse the question
- Step 2: Identify the main features
- Step 3: Introduction writing
- Step 4: Writing an overview
- Step 5: Writing the details paragraph
We’ll give you a walkthrough with our practice question. Find writing pie chart task 1 practice question - the pie charts below show the different types of courses.
Before getting into how to write pie chart, you should know the writing task 1 essay structure. It consists of four sections, which is given below. This standard structure can help students with their IELTS writing to put their thoughts into a better format.
- Paragraph 1 - Introduction
- Paragraph 2 - Overview
- Paragraph 3 - 1st feature
- Paragraph 4 - 2nd feature
Academic writing task 1 pie chart sample question is given below to demonstrate how to write pie chart essay effectively and properly.
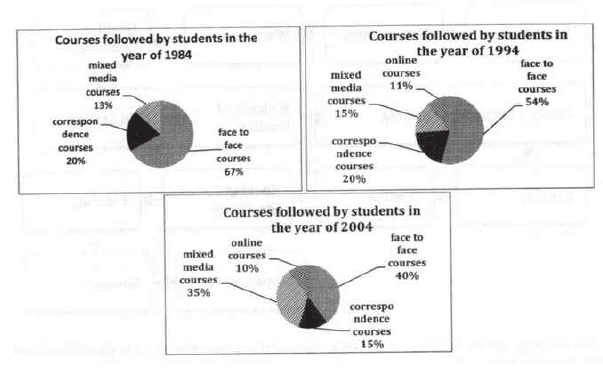
The pie charts below show the different types of courses, which were followed by the students during the years of 1984, 1994 and 2004.
Summarize the information by selecting and reporting the main features, and make comparisons where relevant.
Step 1: Analyse the question
The given pie chart question must be precisely understood in order to give a proper description. We give you the question below and demonstrate how to analyze the question.
“The pie charts below show the different types of courses, which were followed by the students during the years of 1984, 1994 and 2004.
Summarize the information by selecting and reporting the main features, and make comparisons where relevant.”
Every question consists of 3 parts
- Sentence 1 - A brief description of the pie chart
- Sentence 2 - The instructions
- Graph - pie chart, table, graph etc.,
Sentence 1 gives you the brief description of the pie chart graph. And, sentence 2 tells what you are required to do - selecting the main features, writing about the main features and comparing the main features. Graph portion gives you a pictorial representation of the pie chart.
The whole point of this step is to understand the focus of the question and pick out the essential information to talk about. One of the band descriptors of the academic writing task in coherence and cohesion. If you analyse the question properly, your description will be coherent and cohesive.
Also Read: IELTS Writing Band Descriptors
Step 2: Identifying the main features
To describe a pie chart, it is important to identify the main features. Main features are the information that stands out in the pie chart graph. The question is how to determine which are the main features and how to identify it.
Look at the following factors in pie chart graph to figure out the main features,
- Units of measurements
- Time periods
- Title and any labels
- Most obvious trend
- Notable similarities
Based on the above factors, pick out the two or three key features to describe the pie chart in the form of an essay.
Once more, we give the sample pie chart below,
Ask yourself, What are the main features that stand out?
There are two main features that you can observe in the pie chart,
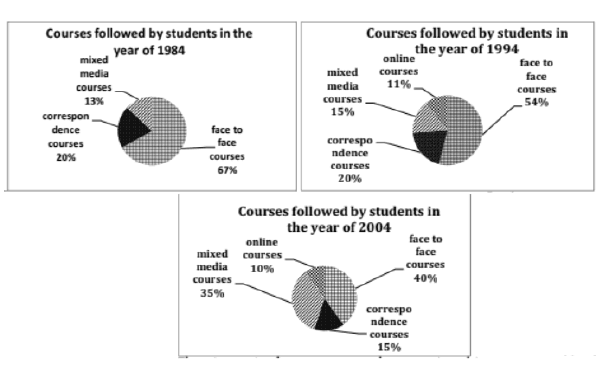
- Main feature 1: Face to Face courses popularity decreased (67 % to 54% to 40% ) by the year of 2004.
- Main feature 2: The usage of mixed media courses was increased (13% to 15% to 35%) by the year of 2004.
Another notable feature of the pie chart is that correspondence courses are stable in both the years 1984 and 1994. But, it dropped down to 5% in the year of 2004.
We need to complete the writing task with 150 words and the time limit is 20 minutes. So, it is better to start an essay with the two features that we have identified. If it doesn’t fit into the 150 words. Then, we can add the final feature to complete the word requirement of the writing task 1 pie chart.
Now, we know what we are going to write. Find the 4 part pie chart essay structure we are going to use below.
- Paragraph 1 - Introduction
- Paragraph 2 - Overview
- Paragraph 3 - 1st main feature
- Paragraph 4 - 2nd main feature
Read IELTS writing task 1 types to understand all of the writing task 1 question types
Step 3: Writing an introduction (Paragraph 1)
To write an introduction you can just rephrase the question. Use the synonyms and change the sentence structure to rephrase the question in a proper manner. For example,
Question: The pie charts below show the different types of courses, which were followed by the students during the years of 1984, 1994 and 2004.
Introduction (Paragraph 1):
The three pie charts represent the types of courses preferred by the students in the years of 1984, 1994 and 2004.
Step 4: Writing an overview (Paragraph 2)
In Paragraph 2, just give general information about the main features. We elaborate in detail in the following paragraphs. The main features we have picked out are given below.
- Main feature 1: Face to Face courses popularity decreased (67 % to 54% to 40% ) by the year of 2004.
- Main feature 2: The usage of mixed media courses was increased (13% to 15% to 35%) by the year of 2004.
- Main feature 3: The correspondence courses are stable in the years of 1984 and 1994. And, dropped down to 5% in the year of 2004.
Write these main features into two or three sentences with 40 words. You don’t need to use complicated vocabulary or grammatical structures. Use the simple synonyms, appropriate words and verb tenses to write an overview.
Overview (Paragraph 2):
The amount of students who used face to face courses gradually decreased by the year of 2004 while the percentage of students who preferred mixed media courses by the year of 2004. And, the rate of correspondence courses has dropped down.
Step 5: Writing the 1st detail paragraph
In Paragraphs 3 and 4, you need to write about the pie chart graph in a detailed format. We already know the main features. So, the task is to expand the main feature 1 in a detailed manner in paragraph 3. Make comparisons, if it is required.
Main feature 1: Face to Face courses popularity decreased (67 % to 54% to 40% ) by the year of 2004.
You can write it in a following way, (take it as an example)
Paragraph 3:
During 1984, 67% of students followed face to face courses. And, In 1994, students who followed face to face courses decreased to 54%. Finally, the followers of face to face courses decreased by 14% and turned to 40%.
Step 6: Writing the 2nd detail paragraph
As we talked earlier, in paragraph 4, we're going to write the main feature 2 in detail. If it is needed, we can even add the third main feature to round off the essay and to reach the required word limit.
Main feature 2: The usage of mixed media courses was increased (13% to 15% to 35%) by the year of 2004.
Main feature 3: The correspondence courses are stable in the years of 1984 and 1994. And, dropped down to 5% in the year of 2004.
Write the above features in a following manner,
Paragraph 4:
The percentage of students who preferred mixed media courses in 1984 is 13%. In 1994, it was gradually increased to 15%. And, in 2004, the percentage drastically increased to 35%. Correspondence courses were stable in both the years of 1984 and 1994 with 20%. It was reduced by 5% in 2004. And, the online courses are followed by the students only in 1994 and 2004.
To enhance your writing task 1 skills, IELTS Writing task 1 tips
Sample pie chart essay
Find the essay in which four paragraphs are combined.
The three pie charts represent the types of courses preferred by the students in the years of 1984, 1994 and 2004.
The amount of students who used face to face courses gradually decreased by the year of 2004 while the percentage of students who preferred mixed media courses by the year of 2004. And, the rate of correspondence courses has dropped down.
During 1984, 67% of students followed face to face courses. And, In 1994, students who followed face to face courses decreased to 54%. Finally, the followers of face to face courses decreased by 14% and turned to 40%.
The percentage of students who preferred mixed media courses in 1984 is 13%. In 1994, it was gradually increased to 15%. And, in 2004, the percentage drastically increased to 35%. Correspondence courses were stable in both the years of 1984 and 1994 with 20%. It was reduced by 5% in 2004. And, the online courses are followed by the students only in 1994 and 2004.
(168 words)
Read IELTS writing task 1 vocabulary for pie chart to develop your knowledge on pie chart vocabulary
Summary
We hope you have learned how to write pie chart. Three things you must keep in mind when attempting the writing task 1 pie chart: word limit (150 words), appropriate words and proper tenses. The process of writing a pie chart consists of 6 steps: analyse the question, identify the main features, writing an introduction, writing an overview, writing the 1st detail paragraph and writing the 2nd detail paragraph. Keep this writing process as a part of your IELTS preparation to achieve band 9 score in the IELTS writing test.
Get more pie chart task 1 sample answers

About Author Dinesh Pandiyan
Dinesh is a highly experienced content writer who specializes in language proficiency tests like IELTS, GRE, PTE, TOEFL, and study abroad. He provides valuable insights and tips to students on various modules of these tests, including reading, writing, speaking, and listening. His articles are well-researched, informative, and engaging, offering practical guidance to students looking to succeed in their academic pursuits. Additionally, Dinesh has coordinated with IELTS trainers to prepare test preparation materials, guides, practice tests, and mock tests, and worked closely with counsellors for study abroad consultancy, providing guidance on choosing the right institution, preparing for interviews, and writing effective statements of purpose (SOP) and letters of recommendation (LOR). Students can benefit from Dinesh's comprehensive knowledge and experience by checking out his articles.
Kanan International is a study abroad consultancy that offers reliable services, products, and solutions for students and education institutions. We support students throughout their study abroad journey, ensuring a hassle-free experience. Our expertise and commitment to excellence make us the go-to partner for expanding global horizons. The company provides coaching for IELTS, GRE, TOEFL, and SAT exams and services like visa consultation, accommodation, scholarship assistance, and education loans.
Free Online Mock Test 2026
Practice our mock test worth Rs. 25000 for Free and know your IELTS score!








Global Headquarters
Kanan Int EdTech Inc
320 Bay Street, Suite 321 (Spaces), Toronto ON, Canada M5B 1N9
Indian Headquarters
Kanan International Pvt. Ltd.
D-wing, 2nd Floor, Trident Complex, Ellora Park Vadiwadi Road, Vadodara, Gujarat 390007
IT/ Digital Campus
Kanan International Pvt. Ltd
Old, New No 3, 2nd Floor, 1A, Dr Sadasivam Rd, T. Nagar, Chennai, Tamil Nadu 600017
Our branches
- Bardoli
- Bharuch
- Chennai
- Dehradun
- Gurugram
- Himatnagar
- Karnal
- Nadiad
- Navsari
- Palanpur
- Rajkot
- Vadodara
- Valsad
- Vallabh Vidyanagar
- Vapi
Study Abroad
Test Prep
Top Universities
Consultants
IELTS Centers
GRE Centers
TOEFL Centers
SAT Centers
Language Courses in Vadodara
SOP Blogs
Featured Blogs
Study Abroad Consultants in Chennai
Study Abroad Consultants in Surat
Study Abroad Consultants in Navsari
Study Abroad Consultants in Bardoli
Study Abroad Consultants in Ahmedabad
Study Abroad Consultants in Anand
Study Abroad Consultants in Khanna
Study Abroad Consultants in Nadiad
Study Abroad Consultants in Vadodara
Study abroad consultants in Valsad
Copyright © 2026 KANAN.CO All rights reserved.