IELTS writing task 1 types


Author
23-06-2025

In the IELTS writing task, you will have two sections to complete within an hour. Any one of the IELTS writing task 1 types will appear on the test paper and ask test takers to complete task 1 in 20 minutes. Candidates should clearly understand the given chart question to give their answer in a minimum of 150 words. It is important to use IELTS writing task 1 vocabulary words wisely.
IELTS writing band descriptors of the IELTS writing task 1 types,
- Task achievement
- Coherence and cohesion
- Lexical resource
- Grammatical range and accuracy
The IELTS Academic writing task 1 asks candidates to summarise the chart or diagram or graph in at least 150 words. Although you will receive one category chart in your exam, it is important to know all the types to complete Task 1 effectively. Learn about the different types of writing task 1 academic by reading this complete article. Practice the IELTS Writing Task 1 samples given here to better understand all chart types.
Check Out our YouTube Channel to Practice Full-Length IELTS Listening Tests Daily

What are the types of academic writing task 1 essays?

The IELTS Academic Writing Task 1 consists of seven different types of chart questions. They are as follows,
- Pie chart
- Bar graph
- Table
- Map
- Process chart
- Line graph
- Multiple graphs
Learn our expert IELTS writing task 1 tips to enhance your IELTS writing band score.
Pie chart
A pie chart is the kind of graph that appears as a circle with divided sections. It represents percentages or proportions of whole information on a particular topic. Candidates are required to write an essay type response in a minimum of 150 words about the given information in the pie chart.
Example for pie chart
You should spend about 20 minutes on this task.
The pie charts show the average consumption of food in the world in 2008 compared to two countries, China and India.
Summarise the information by selecting and reporting the main features and making comparisons where relevant. Write at least 150 words.

IELTS writing task 1 sample answer for pie chart
The pie charts above illustrate the world's average consumption of four types of food in 2008, compared to China and India.
Overall, the percentage of consuming processed food is more and the consumption of nuts and seeds is less than the other three types of foods.
Based on the pie chart, China is the country consuming more vegetables and fruits compared to India. However, the first diagram shows that the world’s average vegetable and fruit consumption is only 29%. Furthermore, the percentage of animal food consumption in India is higher than the China and world average.
While considering nuts and seeds, China holds first place in nuts and seed consumption while India and the world average is only 11% and 4% respectively. Processed food is consumed by 41 % of people in the world which is slightly higher than the other two countries, China and India. Moreover, China places more emphasis on processed foods and vegetables and fruits than the other two food categories.
Word count - 163 words
Click to know more about IELTS writing task 1 pie chart
Bar graph
The bar graph is a type of chart with two axes and rectangular bars. It displays the changes in data over a period of time. A bar graph is also called a bar chart and is similar to a line graph. The rectangular bars can be presented vertically or horizontally.
Example for bar chart
You should spend about 20 minutes on this task.
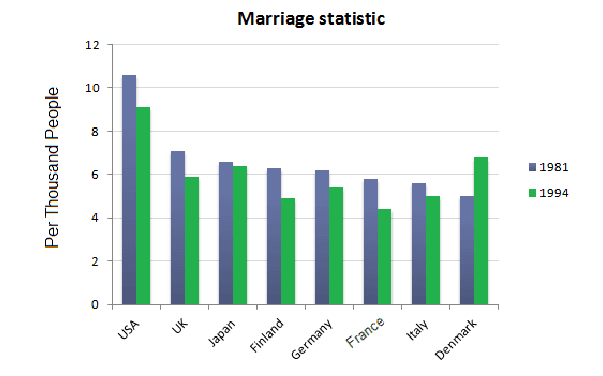
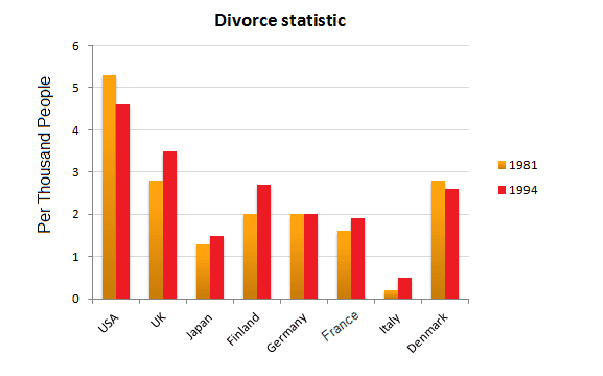
The bar charts below show the Marriage and Divorce Statistics for eight countries in1981 and 1994.
Summarise the information by selecting and reporting the main features and making comparisons where relevant. Write at least 150 words
IELTS writing task 1 sample answer for bar chart
The bar charts provided above show the Marriage and Divorce Statistics for eight countries in the years 1981 and 1994.
While observing two charts, the USA is the only country remaining in a high position in both marriage and divorce statistics in the years 1981 and 1994.
Firstly, considering marriage statistics, the USA had more than 10 people per thousand in 1981 and more than 8 people per thousand in 1994. In 1981, Denmark had the lowest among the other countries. In 1994, except for Denmark, all other countries had slightly decreased marriage statistics.
In divorce statistics, it can be seen that the USA is in the top position of having more than five per thousand people in 1981 and more than four per thousand people in 1994. Next, the UK had the second highest divorce rate in 1994. Moreover, Italy is a country with a very low divorce rate in both the years 1981 and 1994.
Word count - 157 words
Click to know more about IELTS writing task 1 bar graph
Table chart
The table chart is an arrangement of data in rows and columns. It is similar to the bar and line chart but the information is presented in the table. Table charts are used to organise information for better visual representation.
Example for table chart
You should spend about 20 minutes on this task.
The tables below provide information about the consumption and production of potatoes in five parts of the world in 2006.
Summarise the information by selecting and reporting the main features and making comparisons where relevant. Write at least 150 words
| Consumption of potatoes | (kg per person) |
| South and Central America | 23.6 |
| Africa | 14.1 |
| North America | 57.9 |
| Europe | 96.1 |
| Asia | 25.8 |
| Production of potatoes | (in million tonnes) |
| South and Central America | 15.6 |
| Africa | 16.4 |
| North America | 24.7 |
| Europe | 126.3 |
| Asia | 131.2 |
IELTS writing task 1 sample answer for table chart
The tables given above describe the information about the consumption and production of potatoes in five different locations of the world in the year 2006.
Based on the two tables, it is clearly understood that the largest producer of potatoes is Asia and the European population is at the top position in consuming potatoes.
From the first table, data shows that North America is the second largest consumer where people intake nearly 58 kilograms of potatoes. As already mentioned, European people consume 96. 1 kilogram of potatoes which is the highest compared to the other four countries in 2006.
According to the second table chart, South and Central America is the lowest potato producer while people there consume 23. 6 kilograms of potatoes. Europe is the second largest producer while Asia remains the first place in potato production. Furthermore, Asia and Europe are the major potato producers in the year 2006.
Word count - 151 words
Click to know more about IELTS writing task 1 table chart
Map
A map is a visual representation of two places, one is in the past and the other is in the present, showing the major changes between the two places. Candidates should note the progress of the picture from the past to the present and some important aspects.
Example for map chart
You should spend about 20 minutes on this task.
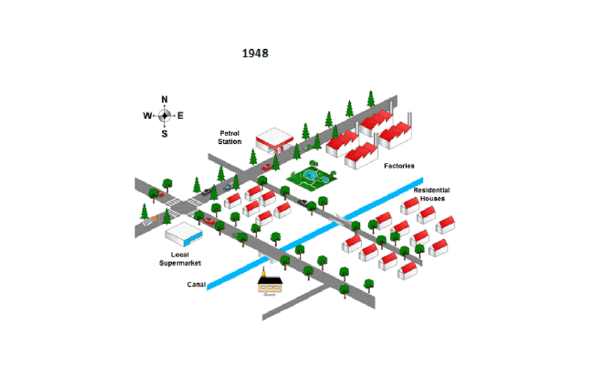
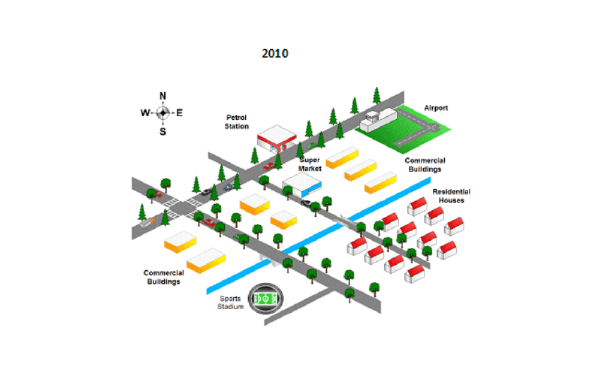
The map below shows the changes in an American town between 1948 and 2010.
Summarise the information by selecting and reporting the main features and making comparisons where relevant.
You should write at least 150 words.
IELTS writing task 1 sample answer for map
The above two given maps represent the same locations with some changes that happened in an American town between the years 1948 and 2010.
In general, it can be clearly seen that there are a number of major changes and newly built constructions have been made between the years 1948 and 2010.
First, commercial buildings occupy more space by destroying local supermarkets, residential houses, and factories. Then, the remaining factories were replaced by the airport. Moreover, the lake which is next to factories was removed to place a supermarket. Furthermore, the church existed in 1948, but it was replaced with the sports stadium on the right of the canal in 2010.
Although many changes took place between 1948 and 2010, the residential houses in the right corner, trees, and canal remain intact in 2010 from 1948. Subsequently, the roads and petrol stations in the north are almost the same in 2010 as they were in 1948.
Word count - 156 words
Click to know more about IELTS writing task 1 map
Process chart
The Process chart is the graph that appears with a series of pictures describing the process or level of how something is made or how something functions. Generally, the process chart has two types, a linear and cyclical process.
Example for process chart
You should spend about 20 minutes on this task.
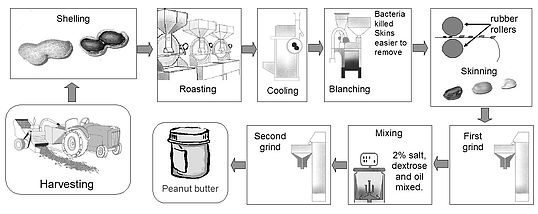
The diagram below shows how peanut butter is made. Summarise the information by selecting and reporting the main features, and make comparisons where relevant.
Write at least 150 words.
IELTS writing task 1 sample answer for Process chart
The given diagram displays the processes of peanut butter making using various types of equipment and methods.
Observing the whole diagram, it is clear that peanut butter production involves nine stages that start with harvesting the peanuts and end with the well-ground butter.
In the first stage, peanuts are harvested underground using machines or humans. In the next step, groundnuts are sent to the roasting machine once their shells are removed. After the roasting process is over, it is set to cool down for some time. The further process is blanching where the bacteria are killed and also it makes skins easier to remove.
Subsequently, the peanuts are run through a roller where the skins are removed. Now, peanuts are ground first before 2% salt, dextrose, and oil are mixed into the peanuts. After adding all the ingredients, the peanut paste undergoes a second grinding process. Ultimately, the peanut butter is ready for packaging and delivery.
Word count - 156 words
Click to know more about IELTS writing task 1 process chart
Line chart
Line chart is the type of chart that has two axes like a bar chart. It is created by marking some points according to data and connecting them with a straight line. The line chart shows the changes that occur in the particular information over some period of time.
Example for line chart
You should spend about 20 minutes on this task.
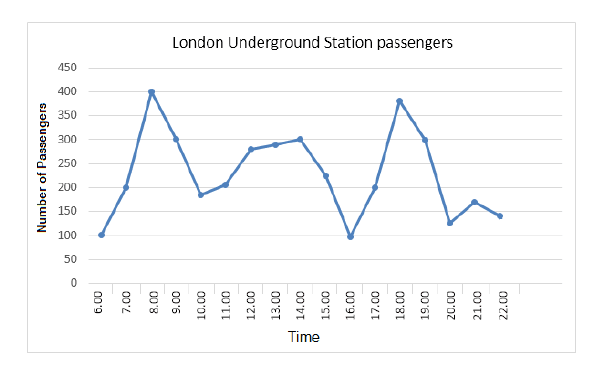
The graph shows Underground Station passenger numbers in London. Summarise the information by selecting and reporting the main features and making comparisons where relevant.
Write at least 150 words
IELTS writing task 1 sample answer for Line chart
The line graph given above displays London’s statistics of the number of passengers who use the underground station and its timings.
Based on the chart, the usage of the underground station passengers is high at 8 am and obviously low at early morning 6 am and midnight 12 am.
First of all, while considering at 6 am, nearly 100 people cross the London underground station and it gradually increases and reaches a high peak at 8 am. Almost 400 people use the underground station at 8 am since it is peak hours. Then it decreases to below 200 people at 10 am. Moreover, it can be seen that the increment in numbers after 11 am.
At 2 pm, approximately 300 people were recorded who crossed the London underground station. Again, it can be seen that the counts dropped from 300 to 100 at 4 pm. Furthermore, the number of people again rose to the second highest peak at 6 pm. Finally, it dropped below 150 at 12 am.
Word count - 168 words
Click to know more about IELTS writing task 1 line graph
Multiple charts
Multiple charts type is the combination of any of the two charts like pie and table chart or bar and line chart or a pie and line chart or any other combination. Candidates will be asked to write an essay about two different charts or graphs.
Example for multiple charts
You should spend about 20 minutes on this task.
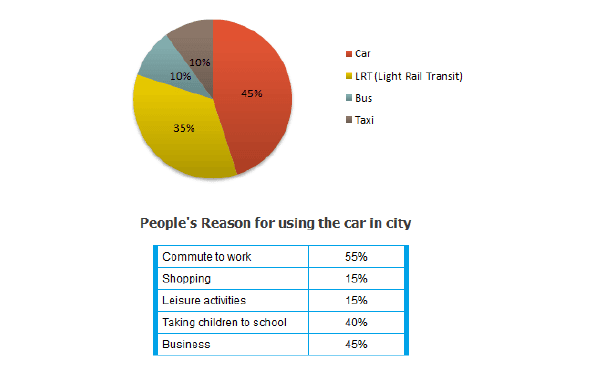
The graphs below give information on transport and car use in Edmonton. Summarise the information by selecting and reporting the main features and making comparisons where relevant.
Write at least 150 words
IELTS writing task 1 sample answer for multiple charts
The above given two different graphs describe the information on the usage percentage of transport and car in Edmonton.
By observing both the charts, it is evident that the car is the most used transportation in Edmonton. And the next charts show the reason for car usage like for work, shopping, etc.
First of all, in the pie chart, it is shown that the usage of different transport by the people. About 45% of people used car transportation while light Rail Transit was used by 35%. The next 20% is shared among Bus and Taxi. 10% of people used buses and the rest 10% people used Taxi for their transportation.
By considering the second chart, the table chart shows the information about the reasons for car usage by people in Edmonton. 55% of people used cars to go to work whereas 45% of people used cars for business. Again 40% of people used cars to drop their children at school and the percentage used cars for shopping and leisure activities was 15%.
Word count - 172 words
Summary
IELTS Academic Writing Task 1 types are much easier compared to writing task 2 types. However, practice is a key factor in cracking Writing Task 1 effortlessly. We have included all types with samples in this article to facilitate your IELTS writing test preparation.
FAQ
1. What are the types of IELTS writing tasks?
In the IELTS writing task, there are two main types of essay questions. Candidates will be provided with an hour to complete writing tasks.
- Task 1 - Candidates are required to write at least 150 words based on the given chart, graph, table, map, or diagram. They should spend 20 minutes on this type.
- Task 2 - Candidates are required to write at least 250 words based on the topic given. They should spend 40 minutes on this type.
2. What is the format of IELTS academic writing task 1?
IELTS academic writing task 1 appears with the chart, graph, table, map, diagram, or combination of charts. Test takers are required to write an essay by pulling the main features with a minimum of 150 words within 20 minutes.
3. Can I write more than 150 words in writing task 1?
Yes, you can. Writing tasks has no upper word limit. However, it is better to write an essay between 160 and 170 words. Writing an essay with too many words wastes time completing writing task 2.
4. What is the difference between IELTS academic writing task1 and IELTS writing task 2?
The major difference between the writing task and task 2 is the word limit. Candidates are asked to write a minimum of 150 words in the task 1 essay and 250 words in the task 2 essay. And the one more difference in question type. Task 1 comes with the chart, graph, map, table, or diagram while task 2 comes with one brief statement on a particular topic.
5. What happens if writing task 1 essay is less than 150 words?
Definitely less than 150 words of essay in writing task 1 is not a good thing and will affect your band score. A short essay may not contain enough information that the examiner is looking for. So, organize your ideas, understand the main features and create your essay of 150 words.
6. How can I achieve a band score of 9 in writing task 1?
- Start with the perfect introduction
- Provide the overview of the question
- Understand the main features
- Separate them into two body paragraphs
- Finally, end up with the conclusion part by giving summary
- Remember that the essay should not exceed 150 or 160 words.
7. How many paragraphs are there in IELTS academic writing task 1?
In total, there are four paragraphs that should be written in IELTS academic writing task 1. They are as follows,
- Introduction
- Overview
- Main body paragraph 1
- Main body paragraph 2

About Author Manimegalai Samidurai
Manimegalai is a multifaceted professional, excelling as an author, writer, and study-abroad expert. Her vast knowledge of English proficiency exams, including IELTS, GRE, SAT, and PTE, and exceptional content writing skills make her a go-to resource for students seeking guidance and support in their foreign education journey. She is a trusted authority in writing content related to these test-prep exams, making her an invaluable resource for those seeking guidance. With her well-researched and informative blogs, articles, and study materials, Manimegalai has helped countless students achieve their desired band scores and get admissions to top-notch colleges & universities in countries like Canada, USA, UK, Australia, Ireland, etc.
Kanan.co is a trusted study abroad consultancy offering comprehensive services, resources, and solutions for students and education institutions. We support students at every stage of their global education journey, ensuring a smooth and guided experience. Along with test preparation for IELTS, GRE, TOEFL, and SAT, we provide expert services such as SOP writing, visa guidance, accommodation support, scholarship assistance, and education loan support. Our expertise and commitment to excellence make us a reliable partner for students pursuing international education.
Free Online Mock Test 2026
Practice our mock test worth Rs. 25000 for Free and know your IELTS score!








Global Headquarters
Kanan Int EdTech Inc
320 Bay Street, Suite 321 (Spaces), Toronto ON, Canada M5B 1N9
Indian Headquarters
Kanan International Pvt. Ltd.
D-wing, 2nd Floor, Trident Complex, Ellora Park Vadiwadi Road, Vadodara, Gujarat 390007
IT/ Digital Campus
Kanan International Pvt. Ltd
Old, New No 3, 2nd Floor, 1A, Dr Sadasivam Rd, T. Nagar, Chennai, Tamil Nadu 600017
Our branches
- Bardoli
- Bharuch
- Chennai
- Dehradun
- Gurugram
- Himatnagar
- Karnal
- Nadiad
- Navsari
- Palanpur
- Rajkot
- Vadodara
- Valsad
- Vallabh Vidyanagar
- Vapi
Study Abroad
Test Prep
Top Universities
Consultants
IELTS Centers
GRE Centers
TOEFL Centers
SAT Centers
Language Courses in Vadodara
SOP Blogs
Featured Blogs
Study Abroad Consultants in Chennai
Study Abroad Consultants in Surat
Study Abroad Consultants in Navsari
Study Abroad Consultants in Bardoli
Study Abroad Consultants in Ahmedabad
Study Abroad Consultants in Anand
Study Abroad Consultants in Khanna
Study Abroad Consultants in Nadiad
Study Abroad Consultants in Vadodara
Study abroad consultants in Valsad
Copyright © 2026 KANAN.CO All rights reserved.