The diagram below shows how the Australian Bureau of Meteorology


Author
24-06-2025

In IELTS writing task 1, a process chart is one of the vital types, and moreover, the diagram below shows how the Australian Bureau of Meteorology is the most repeated topic. This process diagram involves different stages and different options to forecast the weather conditions.
There are seven different chart question types in IELTS writing task 1 where candidates are required to provide their response based on the given chart in a minimum of 150 words in 20 minutes. We’ve given enough samples in this article for the topic “The diagram below shows how the Australian Bureau of Meteorology” for your practice purpose.
Check Out our YouTube Channel to Practice Full-Length IELTS Listening Tests Daily

IELTS Academic Writing Task 1 - Process chart essay writing
You should spend about 20 minutes on this task.
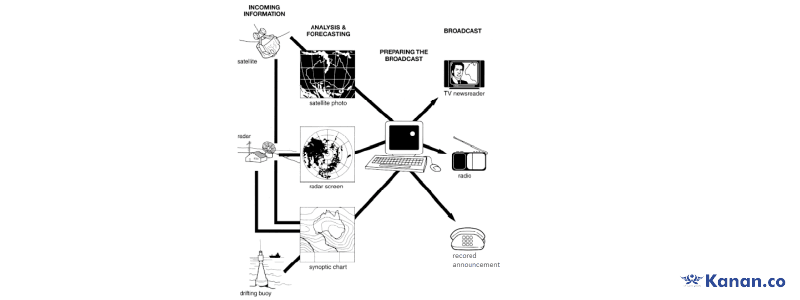
The diagram below shows how the Australian Bureau of Meteorology collects up-to-the-minute information on the weather in order to produce reliable forecasts.
Summarise the information by selecting and reporting the main features, and make comparisons where relevant. Write at least 150 words.
Process chart essay writing structure
- Introduction - Comprehend the provided question tom paraphrase the question using the different words with the same meaning
- Overview - Provide the overall opinion that you observe from the given process chart
- Main body paragraph 1 - Note down the main feature from the first half of the diagram and mention that in your third paragraph
- Main body paragraph 2 - Note down the main feature from the second half of the diagram and mention that in your fourth paragraph
Know more about the process chart task 1
The diagram below shows how the Australian Bureau of Meteorology Model answer 1
The process diagram given above explains the different options and different processes involved in gathering up-to-the-minute weather information to broadcast trustworthy forecasts.
After observing the whole diagram, it can be concluded that the information on the weather is collected through three different options, satellite, radar, and drifting buoy to convey the correct information to the people.
Based on the given process chart, the Australian Bureau collects information from three different techniques like satellite, radar, and drifting buoy. Satellite analysis will be understood by satellite photos while radar study about the weather can be known via radar screen. The next option is a drifting buoy that offers the weather information through a synoptic chart.
Once the weather information is gathered, then the preparation for the broadcast will take place. After broadcast preparation is over, finally the reliable weather information will be published to the public through TV newsreaders on television, radio, and recorded announcements, thus the final stage of this process.
Word count - 160 words
The diagram below shows how the Australian Bureau of Meteorology Model answer 2
The above-described process diagram highlights the various alternatives and procedures involved in acquiring up-to-date weather data to broadcast reliable forecasts.
After carefully examining the entire representation, it is clear that in order to provide the public with accurate weather information, three separate methods are used to gather data: satellite, radar, and drifting buoys.
The Australian Bureau gathers information using three different methods, including satellite, radar, and drifting buoy, as shown in the process chart. Satellite images can help you understand satellite analysis, and a radar screen is another option to acquire weather information. Furthermore, the following alternative is a drifting buoy that provides weather data via a synoptic chart.
The preparation for the broadcast will begin after the weather data has been collected. The reliable weather information will ultimately be released to the public after broadcast preparation is finished via TV newsreaders on television, radio, and recorded announcements, marking the end of this process.
Word count - 154 words
The diagram below shows how the Australian Bureau of Meteorology Model answer 3
The given figure presents the method that is used by the Australian Bureau of Meteorology to gather up-to-date, accurate weather forecasts and share them with a large audience.
In general, the process comprises three key processes, including receiving information, analysing it, and anticipating it, as well as preparing the broadcast and presenting it.
The graph makes it perfectly visible that there are three sources, satellite, radar, and drifting buoys to acquire the right weather information. In the first phase, the Australian Bureau of Meteorology uses a satellite option to collect weather data, then analyzes that data from satellite images and evaluates them to provide forecasts to the public. Following the computer's preparation of the broadcast, the data is broadcast by radio, recorded announcements, and TV newsreaders.
The second technique of gathering weather information is radar, which allows for analysis and forecasting using a radar screen and synoptic chart from drifting buoys. Once the broadcast is made, it is aired on television, radio, and recorders.
Word count - 164 words
The diagram below shows how the Australian Bureau of Meteorology Model answer 4
The above diagram shows the various ways the Australian Bureau of Meteorology collects weather data and the ways in which the latest information is made available to the public.
All things considered, it is obvious that the data is received from satellites, radars, and drifting buoys and released to the public via TV, radio, and recorded audios.
As shown in the diagram, there are three primary types of sources used to gather weather data, they are satellites, radars, and drifting buoys. These three sources of data are input into a computer system to analyse and prepare the weather news for broadcasting to the public. Radar information is viewed from radar screens, synoptic charts are produced from drifting buoys, and satellite photographs make up the majority of the raw data gathered from satellites.
The weather and news are transformed into the public media, including televisions, radios, and recorded announcements. Ultimately, the public is updated by the weather's most up-to-date information via radio broadcasts, TV news, and recorded announcements.
Word count - 167 words
The diagram below shows how the Australian Bureau of Meteorology Model answer 5
The Australian Bureau of Metrology's investigation into weather forecasting is highlighted in the provided visual representation, which appears in the form of a process chart.
On the whole, the procedure consists of four steps. Beginning with the gathering of weather data, Following analysis and preparation for the presentation, this data is subsequently broadcast to the general public.
When examining the first and second stages of the procedure, there are three methods for gathering weather information and three methods for processing it. First, incoming data can be gathered by a satellite and displayed as a satellite image for study. Second, radar may directly gather incoming data and analyse it on a radar screen. Finally, drifting buoys also collect data that can be displayed on a synoptic chart.
The third step of the procedure involves the preparation of the weather broadcast using computers. Finally, it is broadcast to the whole public via radio, television, or a recorded telephone announcement.
Word count - 157 words
Other important process chart topics
- The diagrams below show the life cycle of the silkworm
- The diagram below shows the production of olive oil
- The diagram below shows the recycling process of plastics
- The diagram below shows how rainwater is reused
- The diagram below shows the process of canning of fish
- The diagram below shows the process of making soft cheese
- The diagram below shows the process of milk production
- The diagram below shows the stages of processing cocoa beans
- The diagram below shows the life cycle of salmon
Conclusion
To conclude, we’ve given enough possible samples for the topic “the diagram below shows how the Australian Bureau of Meteorology” in this article for your writing task 1 preparation progress.

About Author Manimegalai Samidurai
Manimegalai is a multifaceted professional, excelling as an author, writer, and study-abroad expert. Her vast knowledge of English proficiency exams, including IELTS, GRE, SAT, and PTE, and exceptional content writing skills make her a go-to resource for students seeking guidance and support in their foreign education journey. She is a trusted authority in writing content related to these test-prep exams, making her an invaluable resource for those seeking guidance. With her well-researched and informative blogs, articles, and study materials, Manimegalai has helped countless students achieve their desired band scores and get admissions to top-notch colleges & universities in countries like Canada, USA, UK, Australia, Ireland, etc.
Kanan.co is a trusted study abroad consultancy offering comprehensive services, resources, and solutions for students and education institutions. We support students at every stage of their global education journey, ensuring a smooth and guided experience. Along with test preparation for IELTS, GRE, TOEFL, and SAT, we provide expert services such as SOP writing, visa guidance, accommodation support, scholarship assistance, and education loan support. Our expertise and commitment to excellence make us a reliable partner for students pursuing international education.
Free Online Mock Test 2026
Practice our mock test worth Rs. 25000 for Free and know your IELTS score!








Global Headquarters
Kanan Int EdTech Inc
320 Bay Street, Suite 321 (Spaces), Toronto ON, Canada M5B 1N9
Indian Headquarters
Kanan International Pvt. Ltd.
D-wing, 2nd Floor, Trident Complex, Ellora Park Vadiwadi Road, Vadodara, Gujarat 390007
IT/ Digital Campus
Kanan International Pvt. Ltd
Old, New No 3, 2nd Floor, 1A, Dr Sadasivam Rd, T. Nagar, Chennai, Tamil Nadu 600017
Our branches
- Bardoli
- Bharuch
- Chennai
- Dehradun
- Gurugram
- Himatnagar
- Karnal
- Nadiad
- Navsari
- Palanpur
- Rajkot
- Vadodara
- Valsad
- Vallabh Vidyanagar
- Vapi
Study Abroad
Test Prep
Top Universities
Consultants
IELTS Centers
GRE Centers
TOEFL Centers
SAT Centers
Language Courses in Vadodara
SOP Blogs
Featured Blogs
Study Abroad Consultants in Chennai
Study Abroad Consultants in Surat
Study Abroad Consultants in Navsari
Study Abroad Consultants in Bardoli
Study Abroad Consultants in Ahmedabad
Study Abroad Consultants in Anand
Study Abroad Consultants in Khanna
Study Abroad Consultants in Nadiad
Study Abroad Consultants in Vadodara
Study abroad consultants in Valsad
Copyright © 2026 KANAN.CO All rights reserved.